Debugging (DAP) Beta
Full debugging for Java, Python, and JavaScript: breakpoints, step in/over/out, watches, set-value, run-to-cursor, inline values, and an interactive console.
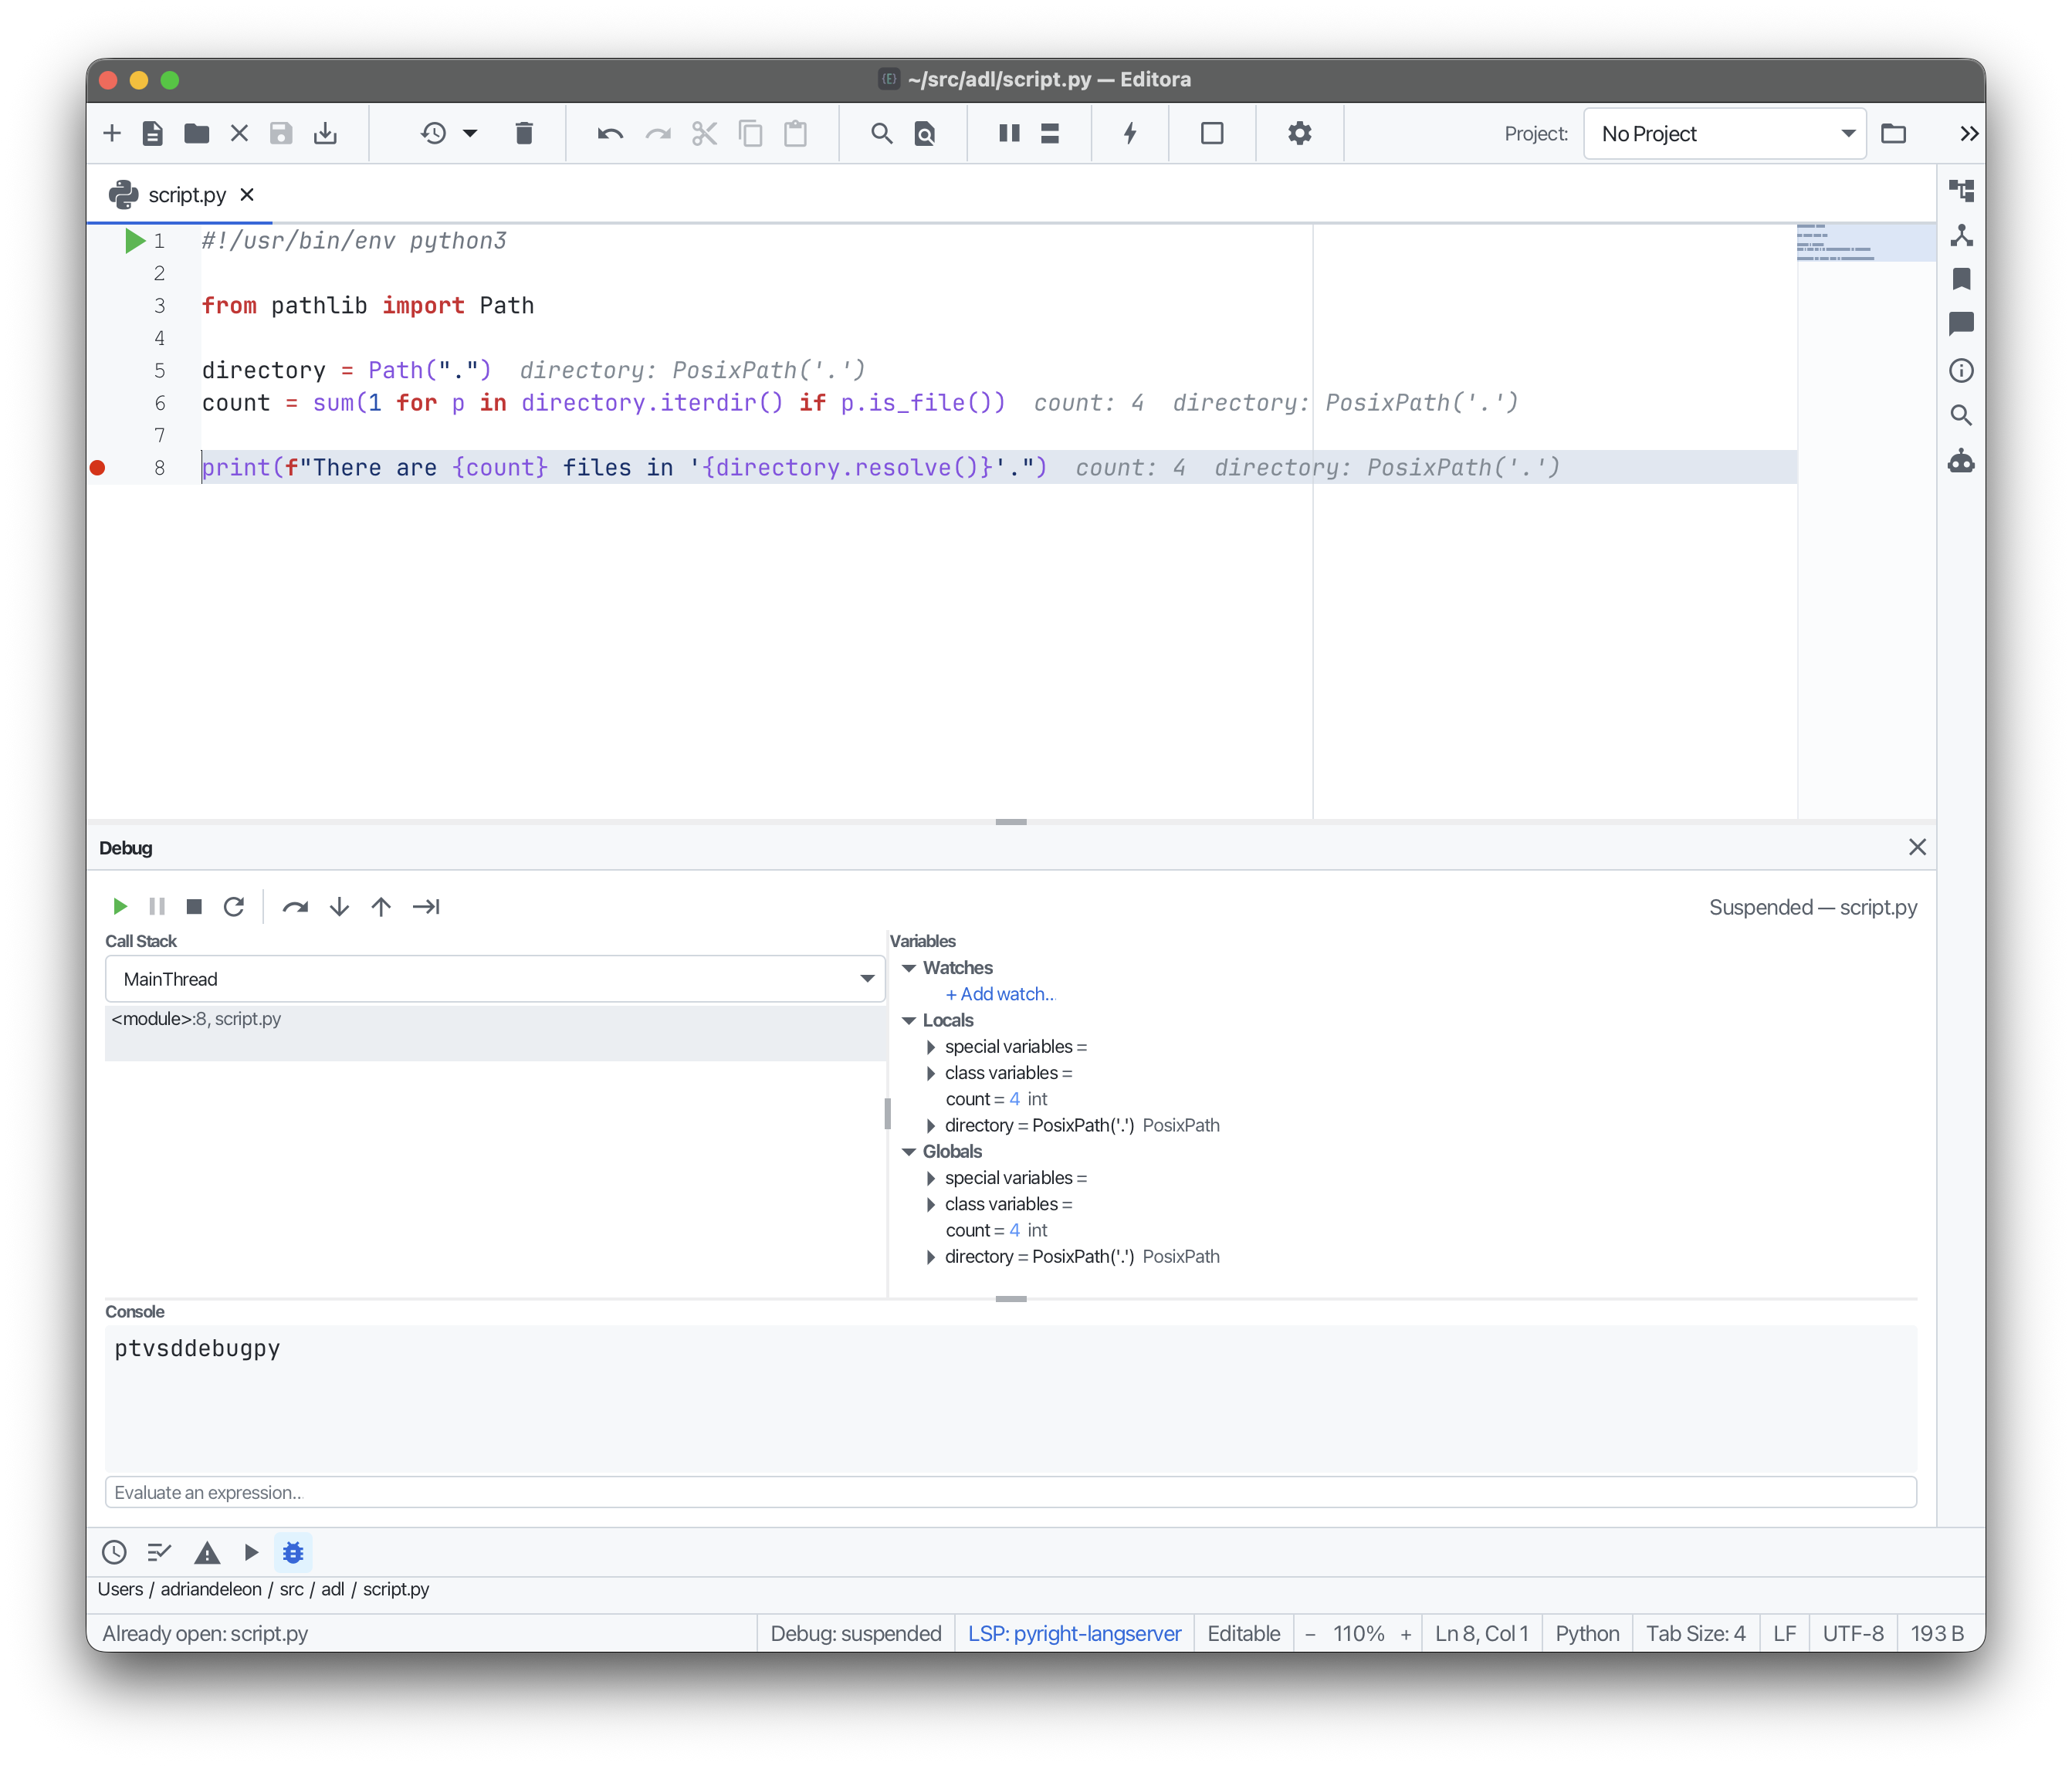
Full debugging for Java, Python, and JavaScript through the Debug Adapter Protocol, with an IntelliJ-style Debug tool window:
- Breakpoints (including conditional and logpoints), step in / over / out, run-to-cursor, and jump-to-line
- A threads + call-stack view and a lazy variables tree with set-value
- Watches and an evaluate console
- A debugged Java program can read standard input typed in the Debug console
- Tests inside JUnit
@Nestedclasses run and debug from the gutter
For Java it goes beyond single files: Debug Main Class… debugs any main in the active file’s Maven or Gradle project (with saved run configurations carrying program and VM arguments and environment variables), and Debug via Build Tool launches a Gradle or Spring Boot app under a suspended JVM and attaches when it is listening.
While suspended, inline values appear after each line and hovering a variable shows its value. The adapters (java-debug, debugpy, vscode-js-debug) are user-installed, not bundled, and a jdtls that already bundles java-debug is detected as-is. Off by default. Enable it under Settings → Debugging. Java debugging runs through the Java language server, so it also needs LSP switched on.