
Running & debugging
Running files
You can run compact Java files, Python scripts, Node.js scripts, shell scripts, Groovy scripts, Kotlin files, Clojure files and Scala files with language services disabled. A green ▶ appears in the gutter of a runnable file:
- a Java compact source file (JEP 512, a
.javawith a top-levelvoid main) or an extensionless Java file with ajava --source 25+shebang, - a Python script (the ▶ sits on the
if __name__ == "__main__"guard, written either way round, with either quote or in parentheses; see Python scripts), - a JavaScript or TypeScript file (
.js,.mjs,.cjs,.ts,.mts,.cts) or a script whose shebang namesnode(see Node.js scripts), or - a shell script:
.sh,.bash,.zsh,.kshand the other shell types, or a file whose shebang names a shell (see Shell scripts). Startup files that a shell reads rather than runs, such as.bashrc,.profile,.zshrc,.bash_logout,.xinitrcand.envrc, get no ▶. - a Groovy script or class (
.groovy): the ▶ sits on itsstatic void mainwhen it has one, else on the first line. See Groovy scripts. - a Kotlin script (
.kts,.main.kts), with the ▶ on its first line, or a.ktfile with a top-levelfun main, with the ▶ on that line. See Kotlin files. - a Clojure file (
.clj,.cljc,.bb, or a script with aclojureorbbshebang): the ▶ sits on its(defn -mainwhen it has one, else on the first line. EDN files (deps.ednand the like),project.cljand ClojureScript (.cljs) get no ▶. See Clojure files. - a Scala program: the ▶ sits on an
@main def, anobject … extends Appor an object’sdef main(args: Array[String]), and on the first line of a.scscript. A build definition (build.sbt,build.mill,build.sc) gets none. See Scala files.
Click the ▶, use the right-click Run File, or bind file.run (C-c r). Output
streams to the Run tool window (M-9), which accepts stdin so
console-style programs work. Double-click a stack-trace line to jump to the
file and line: JVM frames from Java, Kotlin, Groovy, Scala and Clojure code
(and Clojure’s own at my-app.core/f (core.clj:4)), Python and Node frames, and
shell errors such as deploy.sh: line 12: …. A Node frame or a tsc error opens
at its column too, also for an ES module’s file:// path and a path with spaces.
For Python that covers traceback frames of any file (also a script with no .py
extension), app.py:12: locations in warnings and in pytest, mypy or Ruff
output, and pdb’s > app.py(12) lines; <stdin> and <frozen …> frames have
no file to open.
The console’s first line, drawn muted, is the command that started a script or a test run: which interpreter ran, with which options, on which file.
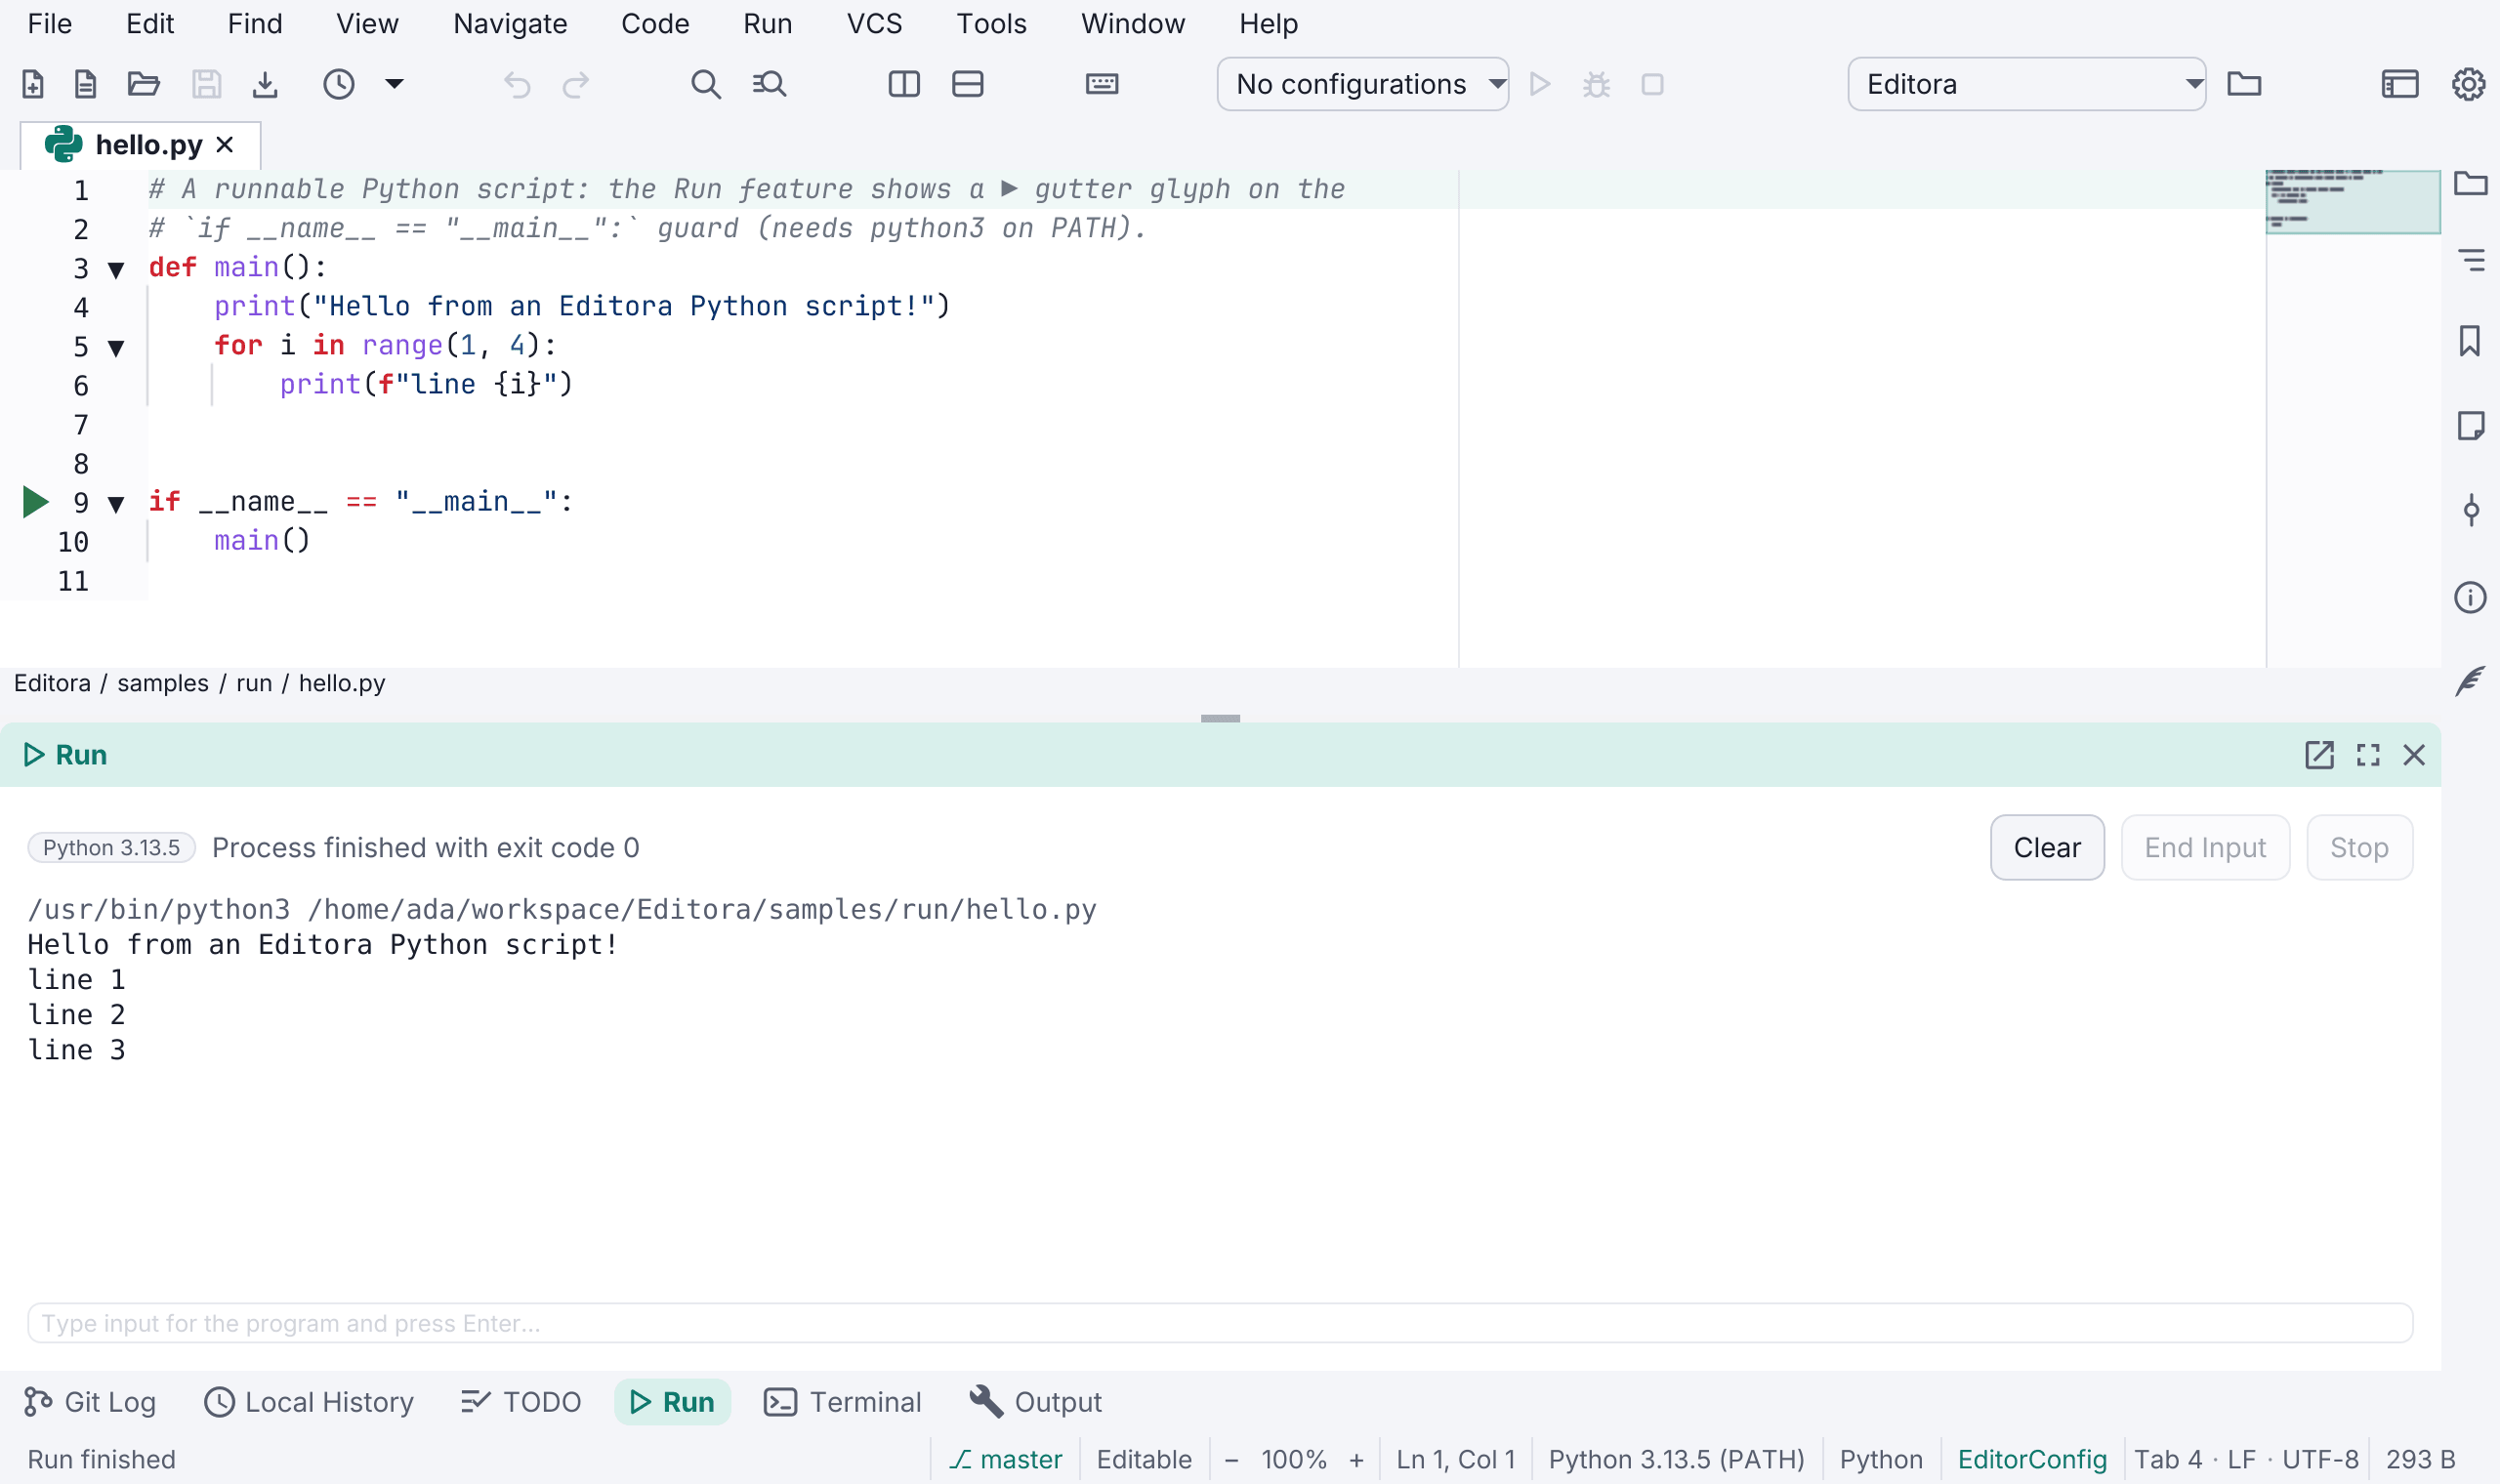
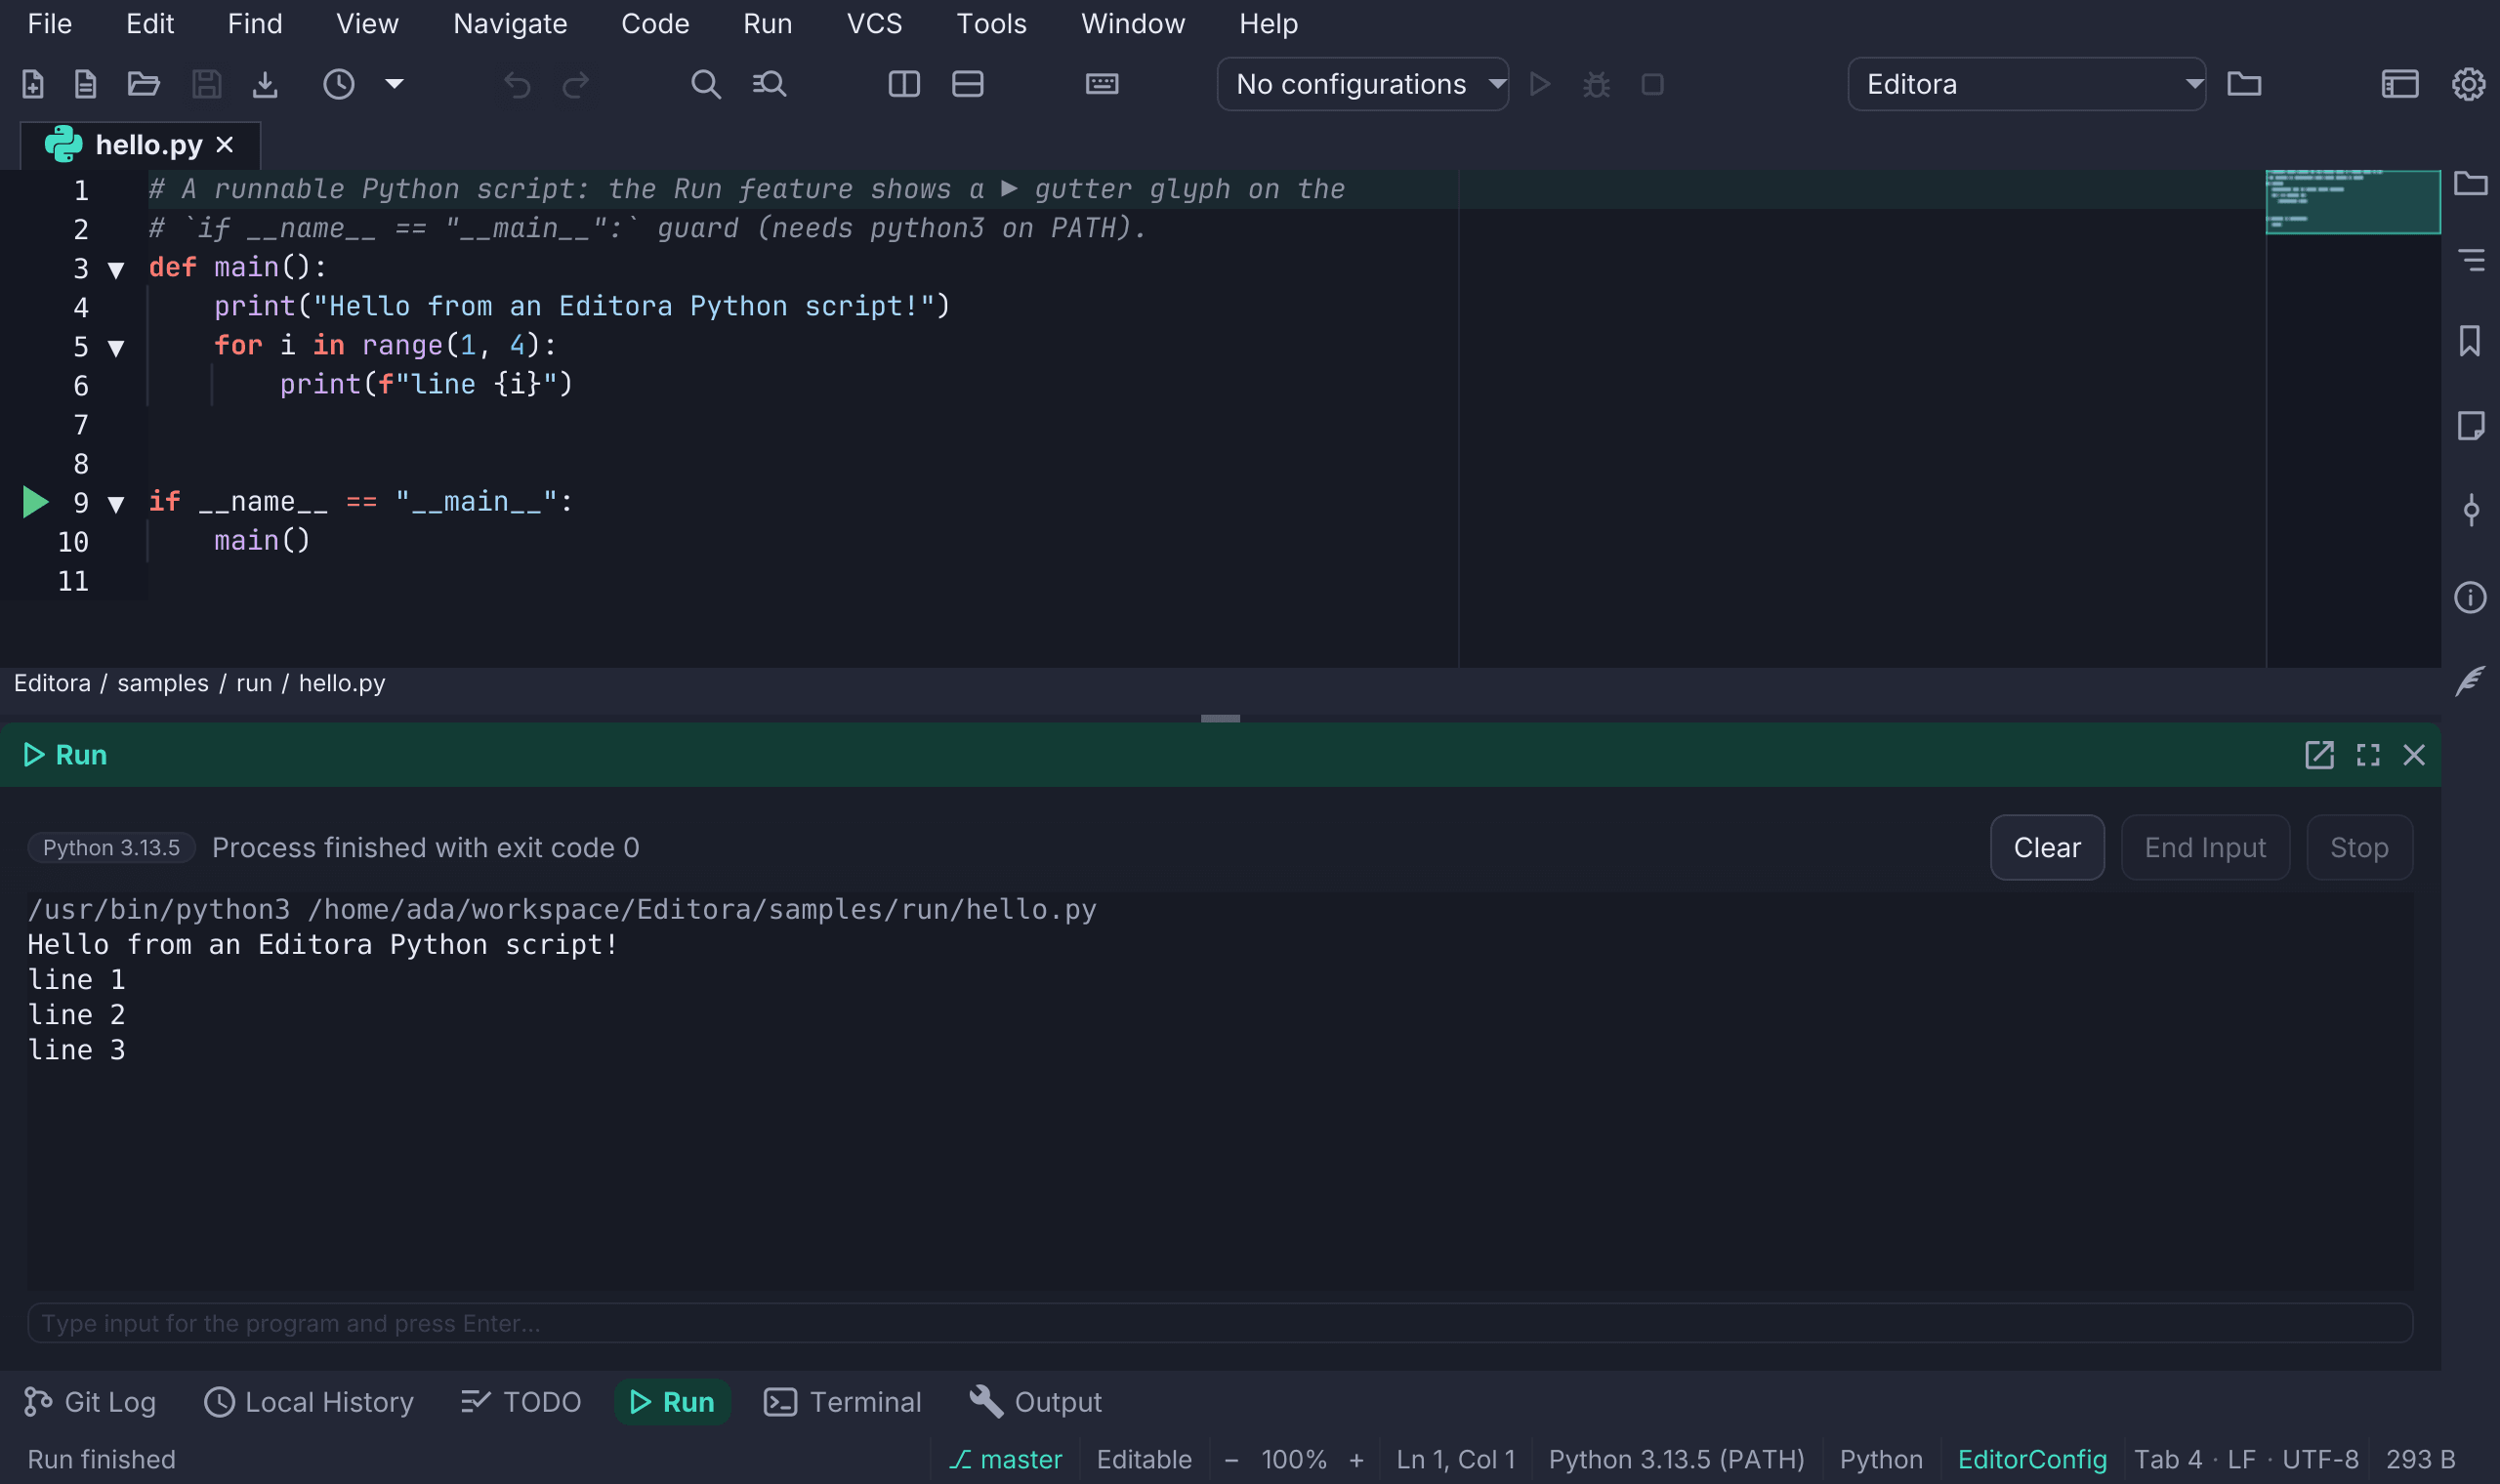
The console reads the terminal codes programs print: colours are drawn in the
theme’s colours, a carriage return (\r) rewrites the current line so a
progress bar stays on one line, and clear empties the console. Other cursor
codes are dropped. Stop ends the program and everything it started, and the
console then says Stopped. On macOS and Linux, a Python or Node.js program
(and npm, pnpm, yarn or bun) started on this computer first gets Ctrl-C
(SIGINT), so it can clean up (a Python program’s finally blocks and atexit
handlers run), and is ended only if it is still running a moment later.
The console keeps the newest output. When a program prints faster than the
console can show, some lines are skipped (the program is never slowed down),
but the last screenful is always complete, and the console says that output
was skipped. When the console reaches its size limit, it drops the oldest
output and says so at the top. End Input in the console’s header, or
Ctrl+D in the empty input field, closes the program’s input, so a loop that
reads lines until the end of input can finish (Run: End Program Input,
run.endInput).
While a program runs, a small spinner turns beside the Run window’s status, from the launch (including a configuration’s before-launch command) until the program exits, is stopped, or fails to start, so a script that prints little does not look stalled. The Run button on the tool-window stripe badges the same spinner on its icon, which shows a run is alive with the Run window closed or another window open in its place.
Which runtime a program runs under
Beside the status, the Run window names the runtime the program runs under: Java 25.0.4 (Temurin), Python 3.13.5, Node.js 24.18.1, Groovy 5.1.3 (Java 25.0.4), Kotlin 2.4.21 (Java 25.0.4), Clojure CLI 1.12.6.1673, Leiningen 2.13.0, Babashka 1.13.226, Scala CLI 1.18.0 (Scala 3.9.0), Bash 5.2.37 or GNU Make 4.4.1. A Java runtime also shows its distribution (Temurin, Corretto, Zulu, GraalVM CE and others) when the JDK names one. Hover the name for the runtime’s own version text and, for Java, the JDK’s folder.
The name comes from the very program the run starts, asked in the run’s folder
and with its environment. A run configuration’s JDK, a virtual environment’s
python, a version picked by pyenv and a remote host’s or container’s own
runtime are therefore what it shows, rather than whatever is first on your
PATH. It appears a moment after the launch (the program does not wait for
it), stays after the program exits, and is replaced by the next run. A plain
sh script and a compiled program show no runtime, and neither does a
configuration’s before-launch command.
A clicked Java frame in the Run, Test or Build console is resolved by the language server, so a frame inside a dependency or the JDK opens its source instead of reporting “not found”. Frames in your own code open as usual, and filename matching handles anything the server can’t place, plus every non-Java trace.
Pass per-file program arguments with file.runWithArgs (remembered across
runs and reused by the debugger), and repeat the last run with run.rerun.
Rerun first saves the file it runs, even when another tab is in front. Run: Find in
Output (run.findInOutput) opens a find bar over the Run console, with every
match highlighted.
Arguments are split the way a shell splits them: quote an argument that
contains spaces ("two words" or 'two words'), and put a backslash before a
space, quote or backslash to keep it (O\'Brien). Inside double quotes, \"
and \\ are escapes; a backslash before any other character stays, so a
Windows path such as C:\tools\x.exe is kept as typed. An unclosed quote
stops the run with a message instead of joining the rest of the line into one
argument. $NAME in an argument is passed as written.
Running a Java file needs JDK 25 or newer. Editora uses the selected Default JDK
when one is configured, or java on your PATH, and checks that exact launcher
before running. An extensionless shebang can request a newer source release.
For Maven projects, Settings → Build Tools → Default JDK selects the toolchain used by Run, Debug, Maven classpath resolution,
Maven tasks, and before-launch steps. Installed JDKs are discovered from the
usual platform locations and common version managers. A run configuration’s
JDK field can inherit that choice or override it for one configuration. The
Default JDK also applies to standalone Java Run and Debug. A Java file or folder
without Maven or Gradle runs on the Default JDK, else on the java on your
PATH, and the Java language server builds it for that same JDK. A changed
Default JDK reaches a running language server at once, with no restart.
Python scripts
Run, Python run configurations, the
test runner and the debugger all use the same
Python. The status-bar item on a Python file shows which one and why, for
example Python 3.13.5 (.venv); click it, or use Python: Select
Interpreter (python.selectInterpreter), to pick another for the project
(see The Python interpreter). The first of
these wins:
- a run configuration’s Interpreter;
- the interpreter picked for the project;
- an environment that was active when Editora started (
$VIRTUAL_ENV, then$CONDA_PREFIX); - a
.venv,venv,envor.envfolder holding apyvenv.cfg, looked for from the script’s folder up to the project root; - the Python interpreter on the Python card of Settings → LSP;
python3, thenpython, on yourPATH. On Windows: thepylauncher (py -3), thenpython, never the Microsoft Store shortcut.
A shebang that asks for a particular Python is followed, as ./script
would follow it. One that names plain python or python3 asks for no
particular Python, so the project’s runs the script, with the shebang’s options:
| First line | Runs |
|---|---|
#!/usr/bin/env python3 | the project’s Python |
#!/usr/bin/python3 -O | the project’s Python with -O |
#!/usr/bin/env python3.12 | python3.12 |
#!/usr/bin/env -S uv run --script | uv run --script script |
pypy, pipx, poetry and pdm shebangs are followed the same way. When the
interpreter a shebang asks for is not installed, the project’s Python runs the
script, and the console and the status line say so. A configuration’s
Interpreter wins over any shebang.
The script runs in its own folder. In a project, the project root, and its
src/ folder when there is one, go in front of PYTHONPATH (anything you set
there stays after them), so from mypackage import x works in a file deep
inside the package. With no project open, PYTHONPATH is left as it is.
Output appears as the program prints it, not in one block at the end
(PYTHONUNBUFFERED=1), and in UTF-8 on every platform (PYTHONIOENCODING), so
print("✓") works on Windows too. A configuration’s Environment can set
either variable differently.
A .pyi stub gets no ▶, and neither do __init__.py and conftest.py unless
they have a __main__ guard. A guard inside a string or docstring does not
count. A test file (test_*.py, *_test.py) gets a ▶ for each test instead,
and Run on it runs its tests: see Test runner.
Shell scripts
A shell script runs under the interpreter its shebang names, as ./script
would in a terminal, with the shebang’s options:
| First line | Runs |
|---|---|
#!/bin/bash -eu | /bin/bash -eu script |
#!/usr/bin/env -S bash -e | bash -e script |
#!/bin/sh | /bin/sh script |
#!/usr/bin/env zsh | zsh script |
#!/usr/bin/env python3 | python3 script |
| none | bash script, or zsh for a .zsh file |
The env forms are read as env reads them: env -u NAME runs the script
without NAME set, and env -C DIR runs it in that folder (Run reports a
folder that does not exist). #!/bin/busybox sh runs busybox’s shell. When an
interpreter path in the shebang does not exist on this machine, Run uses the
command of that name on your PATH instead. A
run configuration can set its own interpreter.
A shell run gets TERM=xterm-256color, so scripts that ask tput for colours
get them. When a bash script asks a question with read -p "Name: ", the
prompt shows in the console, although bash prints such prompts only to a
terminal; type the answer in the input field.
If the script has Windows (CRLF) line endings or starts with a byte-order mark,
Run warns first, because bash then fails with errors that never mention the
cause. Convert and Run saves the file with LF line endings (and UTF-8
without a byte-order mark) and runs it; Run Anyway runs it as it is. When
.editorconfig requires CRLF for the file, only Run Anyway is offered.
On Windows, bash and sh come from Git Bash: the one beside the
git.exe on your PATH, then a standard Git for Windows install, then any other
bash on your PATH (MSYS2, Cygwin). The WSL launcher in System32 is never
used, because it cannot open a Windows path. Lines typed into the console
reach the script with Unix line endings.
A Bash script can be debugged too: see Debugging Bash. A script of another shell, such as zsh or fish, can’t be; use Run with Trace to see each line as it runs.
Node.js scripts
A .js, .mjs, .cjs, .ts, .mts or .cts file runs under Node.js, and
so does a script whose shebang names node. A type declaration file (.d.ts)
has no code, so it gets no ▶. JSX and TSX files need a bundler, so Run does not
start them.
Which Node.js runs. Run, run configurations, Debug, npm scripts and the TypeScript language server all use the same Node.js. The first of these wins:
- a run configuration’s Node.js field;
- the version that a
.nvmrcor.node-versionfile names, when nvm has that version installed. The file is looked for from the script’s folder up to the project root, so a monorepo’s root.nvmrccounts for each of its packages (with no project open, the search stops at the package folder). nvm’s versions are looked for in$NVM_DIR(or$XDG_CONFIG_HOME/nvm), then in~/.nvm. A version such as20or20.11picks the newest matching install; an alias such aslts/*is not followed; - the Node.js field in the Node.js card under Settings → Build Tools;
nodeon yourPATH(the login shell’sPATH, so the default of nvm, fnm or Volta counts).
When a .nvmrc asks for a version that nvm does not have, the run goes on with
the next Node.js in the list, and the Run console says so first, for example
.nvmrc asks for Node.js 18, which nvm does not have: using the Node.js setting
instead.
On a remote host, in WSL or in a container, Run, a test file’s ▶ and Debug
choose in the same order, with that host’s answers. The .nvmrc or
.node-version is read on the host, from the script’s folder up to the project
(or the package folder, with no project). The version comes from the host’s
nvm ($NVM_DIR, else $XDG_CONFIG_HOME/nvm, then ~/.nvm there). Step 3 is
the Node.js set for that host in Settings → Remote → This Host, and step 4
the host’s node. A version the host’s nvm does not have, or an alias such as
lts/*, falls back to those two, and the Run console says so.
Editora’s other npm language servers (HTML, CSS, JSON, YAML, Bash, Pyright…)
skip step 2: they run on the Node.js setting, else node on your PATH, so
an old Node.js a project pins cannot break them.
The tooltip of the Run window’s runtime chip ends with where that Node.js was chosen from, such as Chosen from: .nvmrc, via nvm, on a host too. Doctor has a Node.js row that names the Node.js in use and why it was chosen, for example Node.js setting or .nvmrc, via nvm.
Where it runs. A script runs in its package folder: the nearest folder above
it with a package.json, never one inside node_modules and never your home
folder. Without a package.json, it runs in the script’s own folder.
How it runs. Editora adds --enable-source-maps, so a stack trace from
compiled code names the original source, and sets FORCE_COLOR=1, so the Run
console shows the program’s colours (unless you set NO_COLOR). A node
shebang keeps its flags, such as #!/usr/bin/env -S node --no-warnings, but
runs under the Node.js chosen above. A shebang that names deno, bun, tsx
or ts-node runs with that program, as written.
TypeScript runs the first way that works for the file:
- The project’s tsx. When
node_modules/tsxis in the file’s folder or a folder above it (up to the project root), Node.js runs the file with--import tsx. It is still the Node.js chosen above, with its flags. - The compiled file. When the nearest
tsconfig.jsonhas anoutDirand the file it compiles to exists (src/index.ts→dist/index.js), that file runs, with source maps. The console’s first line says so: Running the compiled dist/index.js (built from src/index.ts). When the compiled file is older than its source, the line says to build again to run your latest changes. - Plain Node.js 22.18 or newer, which removes the types itself. On an
older Node.js, Run says that the file needs 22.18 or newer (or tsx) instead
of showing a syntax error. Plain Node.js cannot map an import of
./greet.jstogreet.ts, which is how a"module": "NodeNext"project writes its imports; when that import fails, a hint follows the error: add tsx to the project (npm install -D tsx), or build it so Run uses the compiled file.
A TypeScript test file’s ▶ takes the same route.
Test files. The ▶ of a test file runs node --test and shows the results
in Test Results. A test file is a
*.test.* or *.spec.* file, or any script under a test/, tests/ or
__tests__/ folder. The Run console shows node’s own readable report, while
Test Results reads a TAP report of the same run. A test file that fails to
load, for example on a missing module, is a failed row named after the file,
with the error and its stack. A skipped or todo test shows as skipped under its
own name, with or without a reason. Rerun Failed and Rerun This Test
work on these results; Rerun Failed on a file that failed to load runs the
whole file again.
While the program runs, the Run window names its runtime, such as Node.js 24.18.1 (see Which runtime a program runs under).
Groovy scripts
A Groovy file runs with groovy on the JDK chosen in Settings for builds and
runs (the one Maven, Gradle and Java use), which Editora passes as
JAVA_HOME. Editora finds groovy through GROOVY_HOME, then your PATH,
then SDKMAN. When none of them has it, Run says Groovy is not installed instead
of starting anything. A Gradle build script (build.gradle) and a
Jenkinsfile are Groovy too, but they get no ▶: nobody runs those as a
program.
Kotlin files
Kotlin runs with the Kotlin compiler, kotlinc, on the JDK chosen in Settings
for builds and runs (the one Maven, Gradle and Java use). Editora finds
kotlinc through KOTLIN_HOME, then your PATH, then SDKMAN (sdk install kotlin). When none of them has it, Run says Kotlin is not installed instead of
starting anything. Only kotlinc is used: JetBrains’ newer Kotlin toolchain
command is also called kotlin and is not the compiler.
- A script (
.kts,.main.kts) runs withkotlinc -script, from the top. - A program (a
.ktfile with a top-levelfun main) is compiled first, together with the Kotlin standard library, into a jar that Editora keeps in its config folder, and then runs withjava -jar. The compile shows in the Run window, and Stop ends it. Running the file again without changing it skips the compile; after an edit the file is compiled again and the old jar is deleted. The file is compiled on its own, so a.ktfile that uses other files of a Gradle project runs through the build tool instead.
A Gradle build script (build.gradle.kts, settings.gradle.kts) gets no ▶. A
Kotlin program in a remote folder is not compiled from here;
a Kotlin script there runs on its host.
Clojure files
A Clojure file runs with one of three tools, picked from the file and its
project, the nearest folder above it with a deps.edn, project.clj or
bb.edn:
| The file | Runs as |
|---|---|
a namespace with -main in a deps.edn project | clojure -M -m my-app.core, in the project folder |
a namespace with -main in a project.clj project | lein run -m my-app.core, in the project folder |
a namespace with -main in no project | clojure -M -m hello, with the file’s folder on the classpath |
any other .clj or .cljc file | a script: clojure -M <file> (or lein run -m clojure.main <file>) |
a .bb file, a #!/usr/bin/env bb script, or any file of a project with only a bb.edn | bb <file> |
A namespace runs through -m only when its name matches its path, such as
my-app.core in src/my_app/core.clj, so the tool can find it on the
classpath. A namespace outside src is added to it for the run. A project with
both a deps.edn and a project.clj runs with the Clojure CLI.
A run in a project folder loads the project’s own file, which can run code of
its own: Leiningen evaluates project.clj and its plugins, a deps.edn alias
can add JVM options such as a -javaagent, and Babashka reads bb.edn. So
Run and Debug on a file of such a project first ask you to
trust the folder, as the tool’s
tasks window does; declining runs nothing, and
Rerun asks again if you revoked the trust since. A file in no project is run
without asking.
The Clojure CLI and Leiningen run on the JDK chosen in Settings for builds and
runs. Since Clojure 1.10.1 the CLI writes an uncaught exception’s stack trace
to a temporary file and prints only a summary; Run sets
clojure.main.report=stderr, so the whole report is in the Run console and its
frames are links.
Editora finds clojure, lein and bb on your PATH. When the one a file
needs is missing, Run says so instead of starting anything. On Windows the
Clojure CLI is best used under WSL; see
Running in a container or WSL.
Scala files
How a Scala file runs depends on the build it belongs to:
- A file of an sbt build (a
build.sbtabove it) runs its main class through sbt, in the sbt console of the Output window:sbt "runMain demo.hello"with your arguments, from the build’s root (the highest folder with abuild.sbt). - A file of a Mill build runs through Mill the same way:
./mill app.runMain demo.hello, whereappis the module whosesrcfolder holds the file. The project’s own./milllauncher is used when it has one. - A file of a Gradle or Maven build is run from that build’s tool window; Run says so instead of running the file on its own.
- Any other file, and a
.scscript, runs with Scala CLI:scala-cli run Main.scala -- args. In a Scala CLI project (a folder withproject.scala), the whole folder runs, with the file’s main class. Scala CLI reads the//> usingdirectives for dependencies and the Scala version.
sbt and Mill compile and run the build’s own Scala code (build.sbt and
project/, build.mill or build.sc), and Scala CLI given a project folder
runs the macros and compiler plugins of every source there. So the first run in
a folder you have not trusted asks you to
trust the folder, as the
build tools do, and so does Debug; declining runs nothing.
A file Scala CLI runs on its own is run without asking.
Scala CLI runs on the JDK chosen in Settings for builds and runs, which Editora
passes as JAVA_HOME. Editora finds it as scala-cli on your PATH, then
scala (the scala command is Scala CLI since Scala 3.5), then SDKMAN’s
scalacli and scala. When there is none, Run says Scala CLI is not installed
instead of starting anything. The first run of a Scala version downloads its
compiler, so it takes longer.
Run with Trace
Run: Run with Trace (run.trace, also in the Run menu and the editor’s
right-click menu on a shell script) runs the active shell script with -x,
keeping the shebang’s interpreter. Under bash, each command is printed before
it runs with its file and line:
+/home/me/deploy.sh:12: tar czf site.tgz publicDouble-click a trace line to open that line. Trace lines are drawn muted, not
as errors. A script run by sh or dash is traced too, but its trace lines
carry no file and line, because those shells can’t print them. zsh scripts and
scripts in other languages can’t be traced.
To trace a run configuration, put -x in its
Interpreter options; the trace lines link to their source the same way.
Running on a remote host
A file in a remote folder runs on its host, when that host
may run commands; otherwise
Run says so when you launch it. Remote is in Beta. That covers Run on a file, a Java project’s main
class (the gutter ▶, Run Main Class, or a saved configuration, with the class
path the host’s jdtls or Maven gives), and script, make and npm
configurations of a remote project. A shell script runs under the interpreter
its shebang names, found on the host, and Run with Trace works there too; the
read -p prompts described above show only for a local run. Output, input and
Stop work as for a local run, over the same SSH connection, and a makefile at a remote project’s root
shows the run-configuration toolbar as it does locally. A configuration’s
working directory is a folder on the host.
The host’s own java is used, or the JDK home set for that host in
Settings → Remote. Your local Default JDK and a configuration’s JDK override
are paths on this machine, so they are not sent to the host.
A Python script or configuration runs under the configuration’s
Interpreter, the interpreter picked for the project, or the project’s venv
on the host (a .venv, venv, env or .env folder there). Without one, it
uses the host’s Python for Run and tests from Settings → Remote → This Host
(see Remote), then the Python
interpreter on Settings → LSP → Python when that is a plain command name
rather than a path on this machine, then the host’s python3. PYTHONPATH gets
the project root and its src/ folder; the host’s own PYTHONPATH is not
kept, because Editora does not know it. Stop ends a remote program straight
away, without the Ctrl-C a local Python program gets first.
A Node.js script runs from its package folder there, the nearest folder above
it on the host with a package.json, as it does locally. This holds in a
container and in WSL too. A .nvmrc or .node-version on the host picks its
Node.js from the host’s nvm (see Node.js scripts).
A project on this machine can run on a host too: set a configuration’s Run on to a deployment, and Editora copies what changed in the project to a folder on the host before each run, then runs the program there.
Running in a container or WSL
A project whose tools run in a container
or, on Windows, in a WSL distribution runs
its programs there: Run on a file, a main class, and every kind of run
configuration, with the java, interpreters and environment the container or
distribution has. Output, input and Stop work as for a local run, and Stop ends
what the program started inside. The files are handed over by the names they
have inside, and a configuration’s absolute working directory is read as a
folder there. Containers and WSL are part of Remote, which is in
Beta.
A Python script picks its interpreter as on a remote host: the configuration’s
Interpreter, the project’s pick, or the project’s venv (one created inside
the container or distribution, named by its path there), else the python3
found inside. Stop ends it straight away, as on a remote host.
Running a project’s main class
Beyond single files, Run: Run Main Class… (run.mainClass) and
Debug: Debug Main Class… (debug.mainClass) pick any main class in the
active file’s Maven or Gradle project and run it in the Run console or debug
it with breakpoints. A green ▶ also appears in the gutter next to every
public static void main, and the editor right-click menu offers
Run ‘….main()’ and Debug ‘….main()’ (Debug: Debug Main Class at
Caret, debug.mainClassAtCaret).
Run: Run Context at Caret (run.context; Ctrl+Shift+F10, or ⌃⇧R on
macOS, in the IntelliJ keymaps) runs whatever the caret is in: the test at the
caret (the whole test class when the caret is above its declaration), else the
class’s main as its ▶ does, else the file. A Java class with neither says so.
There are two paths under that, picked automatically:
- With the Java language server set up, Editora asks it for the project’s main classes and resolved classpath. This is the fast, project-wide path, and it is the only one that can debug. In a folder you have not trusted the server runs without the build, so it knows only the JDK’s classes and the project’s sources (see Servers that load a project’s build).
- Without it, plain Run falls back to the build tool: Maven resolves the
classpath (
compile dependency:build-classpath) and runs the file’smain, and Gradle delegates to itsruntask, orbootRunin a Spring Boot project. In a multi-module Maven build the fallback finds the module’s reactor through the poms’<modules>(an aggregator one level down, or amodules/folder without a pom of its own, counts; the search never leaves the open project) and, when the root lists the module, runs from the root with-pl <module> -am, so a submodule that depends on an uninstalled sibling still runs. A module the reactor does not hold builds alone, and a build that fails with “Could not find the selected project in the reactor” is retried for the module alone; the Run console says which mode ran. The checked profiles and flags of the Maven window are appended (its Reactor toggle is not: the fallback decides that itself). The Maven it runs is the one the Maven window runs (./mvnwonce trusted, the command override, elsemvnon yourPATH), in the Run console: its output streams there, Stop ends it, and a second Run is refused while it runs. When it fails, the status quotes Maven’s first[ERROR]line. The program’s classpath carries the compile and runtime scopes only; a class undersrc/testgets the test classpath. The program runs on the Default JDK’sjava; with none selected, on$JAVA_HOME/bin/java, the one Maven compiled with, and only without aJAVA_HOMEon thejavaof yourPATH.
The fallback compiles as part of resolving the classpath, and in a Maven or
Gradle project on this computer the language-server path builds first too:
Maven’s compile (test-compile for a class under src/test) or Gradle’s
compileJava (compileTestJava) runs in the Run or Debug console before the
launch, through the project’s wrapper once trusted, the command override, or
the tool on your PATH. The Maven compile builds from the reactor root with
-pl <module> -am when the root lists the module, else the module alone, and
carries the Maven window’s checked profiles and flags, as the fallback does.
A failed build aborts the launch, so a fresh clone does
not stop with ClassNotFoundException and an edited file never runs the
previous binary. Settings → Build Tools → Build before Run and Debug (on)
turns it off; a run configuration with its own
before-launch step keeps that step and is not
built twice. A launch that ran without the build prints a hint to build when
the JVM cannot find the main class.
Run configurations
A run configuration saves how something is launched: a name, what to launch, program arguments, VM arguments, environment variables, an optional JDK override, and a working directory.
Run configurations belong to a project: each
project window keeps its own list. The No Project window has none; there, a
script or a compact Java file runs from its gutter ▶ or File: Run
(file.run), as described in Running files.
Environment takes KEY=value pairs, quoted and escaped like
program arguments. $NAME and ${NAME} in a value expand
to that variable: one set earlier in the same field, or else the environment
the program would get anyway, so PATH=/opt/tools/bin:$PATH adds a folder to
the real PATH. Single quotes keep $ as it is. In a remote project, a
variable that is not set earlier in the field is passed to the host as written.
An entry @path, with no =, loads a .env file, as VS Code’s envFile
does: @.env, or "@config/dev env/.env" in quotes when the path has spaces.
A relative path is relative to the configuration’s working directory. The file
holds one NAME=value per line, read the way dotenv tools read it:
- blank lines and lines starting with
#are skipped, and anexportbefore the name is dropped; - a value in single quotes is taken as written;
- a value in double quotes expands
$NAMEand${NAME}, and reads\n,\t,\"and\\as escapes; - an unquoted value ends at a
#comment, is trimmed, and expands$NAMEand${NAME}.
A name expands to a variable set earlier in the file or the field, else to the
environment the program would get anyway. The file’s variables are set where
the entry stands, so a later NAME=value overrides one of them and can use it
as $NAME: @.env DEBUG=1 keeps the file’s values but turns DEBUG on. When
the file cannot be read, Run and Debug stop before launching, and the status
bar names the configuration and the file, such as Run configuration “API”:
cannot read the environment file /home/me/api/.env.
A relative Working directory is relative to the project root, and a blank one means the project root, except for a Python script: that runs in the script’s own folder, as its gutter ▶ does. A relative script path is relative to the project root too, whatever the working directory. Run names a working directory or script that does not exist, and opens the configuration at the field to fix.
Run on picks where the configuration runs: This machine, or one of the project’s deployments, a folder on an SSH host that the project is copied to before the run. Deployments… beside it opens the list.
What a configuration can launch
Pick a Type in the project’s Run Configurations window:
| Type | Launches |
|---|---|
| Java main class | a main in the project, via the language server or the build tool |
| Python script | a .py file with the project’s Python (see Python scripts) |
| Python module | a module by its name, as python -m app.main does, from the project root |
| Shell script | a script with the interpreter its shebang names (or bash), unless Interpreter is set |
| Node.js script | a .js or .ts file under Node.js |
| Groovy script | a .groovy file with groovy, on the configuration’s JDK; its VM arguments go into JAVA_OPTS |
| Kotlin file | a .kts script with kotlinc -script, or a .kt program compiled and run with java -jar, on the configuration’s JDK |
| Clojure script | a Clojure file with the tool Run File picks, on the configuration’s JDK; its VM arguments go to the program’s JVM (-J arguments for the Clojure CLI, JVM_OPTS for Leiningen) |
| Scala (Scala CLI) | a .scala or .sc file with Scala CLI, on the configuration’s JDK; its VM arguments are passed as --java-opt |
| C program / C++ program | a C or C++ file, built the way Debug builds it: its CMake or Make project, or the file alone with cc or c++ |
| Go program | a Go file’s package (or the file alone outside a module); a test file runs all its tests |
| Rust program (Cargo) | a Rust file’s Cargo package; a test file runs all its tests |
| Make target | a target in a makefile |
| npm script | a named package.json script, run with the project’s package manager |
A C, C++, Go or Rust configuration names a source file and builds it the way
Debug does, then Run starts the program in the Run console (or a Terminal tab)
and Debug starts it under CodeLLDB (GDB when that is the C and C++ debugger) or
Delve. Both use the configuration’s arguments, environment variables, working
directory and before-launch step; a blank working directory is the folder Debug
uses for the file. These configurations build and run on this computer only,
not on a remote host, in a container or on a deployment, and Run on a Go file
of a package other than main says the file has no program to run.
The form shows only the fields the selected type uses. A Java main class
has no Script / target field; a Python, Node.js, shell, Make or npm
configuration has no Main class, Module, VM arguments or JDK, and a Groovy or
Clojure or Scala one keeps only VM arguments and JDK of those. A hidden field
keeps its value, so switching the type and back loses nothing. A Python,
Node.js, shell, Groovy, Clojure or Scala file can be picked with Browse…
beside Script / target;
a script inside the project is saved relative to the project root. A Clojure
configuration with no working directory runs in its project’s folder. For an
npm configuration, Browse… lists the scripts in the package.json instead.
A Java main class configuration has Browse… beside Main class: pick a
.java file and its fully qualified class name is filled in, so
src/main/java/test/App.java gives test.App. The name comes from a main
method the file declares, or else from the file’s package and name. A
configuration still named “New Configuration”, or named after the class it
launched before, is renamed after the new class; a name you typed is kept.
A Node.js script configuration has Script, Node.js options (such
as --max-old-space-size=4096), Node.js, program arguments and
environment. Left blank, Node.js is picked the way Run picks it (see
Node.js scripts), and a blank working directory is the
package folder, the nearest one with a package.json. A Node.js path that
does not exist stops the run with a message that names it, and the
configuration opens so you can fix it. Before launch can run a command
first, such as npm run build.
An npm script configuration runs <manager> run <name>, with its arguments
after --. The manager is the one the project uses (npm, pnpm, yarn or bun), as
in the Package Scripts
window, so a pnpm workspace member runs pnpm too. The npm command set in
Settings → Build Tools applies only when it names that same manager, or is a
wrapper script. A package script also runs its pre and post scripts, so
Run and Debug on an npm configuration first ask you to
trust the folder, as the Package Scripts
window does; declining runs nothing.
A shell configuration also has Interpreter and Interpreter options.
Left blank, the script’s shebang decides (see Shell scripts);
set, they replace it, for example /opt/homebrew/bin/bash with -eu. Options
alone keep the shebang’s interpreter and replace its options.
A Python script or module configuration has them too. Interpreter names the
Python for this configuration (a path relative to the project root, such as
.venv-311/bin/python, works); left blank, the project’s Python runs it, chosen
as described in Python scripts. Interpreter options go
between the interpreter and the script, for example -X dev -W error. A Python
module configuration takes the module name in Script / target, the part after
python -m (for example app.main).
Script and make configurations need no language server. Java, Groovy, Kotlin, Clojure, Scala, Node.js script and npm script configurations can be debugged. A Node.js or npm configuration is debugged the way Run starts it, with the same Node.js, package manager, folder and environment (see Debugging JavaScript and TypeScript). Debugging a Node.js or npm configuration of a remote project is not supported yet. Debug on any other type says so. For a shell configuration it says to open its Bash script and debug it there, or to use Run with Trace.
The toolbar selector
The toolbar carries a configuration dropdown with Run, Debug and Stop
beside it; your choice is remembered across restarts. The dropdown ends with
Edit Configurations…, which opens the separate Run Configurations window
with the configuration you had selected already picked out. The same window is
available as Run: Edit Run Configurations… (run.editConfigs).
Starting a file or configuration always opens and focuses the Run tool window. If that process is already active, Run brings its existing console back instead of hiding the useful output behind a busy message.
The group only appears in a project window where you could launch something: a
Maven, Gradle, npm, Cargo or Go build file inside the project, or a makefile
at its root. Anything you have already saved keeps the group visible
regardless, because a configuration only needs a main method and a plain Java
folder can hold one. The palette commands work in any project either way. The
No Project window never shows the group, and its run configuration commands say
to open a project.
Each configuration also becomes a real command, so it appears in the palette by name and can be given its own keyboard shortcut in Settings → Keymaps, the same way saved macros and external tools work.
A step before the launch
A configuration can name a command to run first, such as a build or a codegen step. A non-zero exit aborts the launch, so a stale binary is never run by accident. The step runs in the configuration’s working directory; for a Python script with a blank one, it runs at the project root. A Java configuration’s step always runs in its project root, whatever the working directory, because it is usually a build.
The step may name a build tool instead of a program: maven:compile or
gradle:compileJava runs that goal or task through the project’s own Maven or
Gradle (its wrapper once trusted, the command override, else the tool on your
PATH), resolved at run time, so the saved configuration does not freeze a
command that goes stale when your Maven moves. A project generated by
New Maven Project stores maven:compile
and leaves the working directory blank, which means the project root. A saved
Java configuration builds and runs in the module its project name (the pom’s
artifactId) or its main class’s source file belongs to, whatever file is
active when you run it.
A Java configuration with a step of its own runs that step instead of the
automatic build before a launch.
Running in a Terminal tab
A configuration’s Console option, Run in a Terminal tab, runs its program in the Terminal tool window instead of the Run console. Use it for programs that draw on the screen, read single keys, or ask for a password, which need a real terminal. It works for every type, on this computer, on the project’s host, and in its container or WSL distribution.
- The step before the launch still runs in the Run console first.
- The tab is named after the configuration. When the program ends, it stays, with the program’s exit code in the corner, and the status bar gives the exit code too. Closing the tab while the program runs asks first.
- The Run console’s own tools don’t apply. Stack-trace links, the runtime chip, End Input and Stop belong to the console. Rerun repeats the last run that used the console, so after a terminal run it is unavailable until the next console run.
Sharing them with your team
| Action | Command |
|---|---|
| Write them into the project | run.exportConfigs |
| Merge the project’s back in | run.importConfigs |
Export Configurations to Project writes them to
.editora/run-configurations.json inside the project, where they can be
committed alongside the project’s committed settings.
Import merges them back by name, so importing twice doesn’t duplicate and
a colleague’s edit updates a configuration rather than doubling it.
What the file holds
Export writes every configuration of the window, and the project’s deployments, replacing the file. It is plain JSON, one object per configuration:
{
  "configurations": [
    {
      "name": "App",
      "type": "java",
      "mainClass": "com.example.App",
      "args": "--port 8080",
      "vmArgs": "-Xmx512m",
      "env": "LOG_LEVEL=debug",
      "beforeLaunch": "maven:compile"
    },
    {
      "name": "serve.py",
      "type": "python",
      "target": "scripts/serve.py",
      "workingDir": ""
    }
  ]
}
type is java, python, python-module, shell, make, npm, node,
groovy, kotlin, scala or clojure. A field left out is blank, and a
blank field means the default described above. Relative paths in target and
workingDir are relative to the project root.
Before you commit it:
- Machine paths travel too. A JDK (
jdkHome), an interpreter or Node.js path (interpreter), or a deployment’s key file is written as you set it, so a path that exists only on your computer fails on a colleague’s. Leave these blank to use each machine’s default. A Python interpreter can also be a path relative to the project root, such as.venv/bin/python. - Environment values are written as typed. Keep secrets out of a configuration you share.
- A file that cannot be read counts as empty. A hand edit that breaks the JSON makes Import say there are no shared configurations, rather than naming the error. Unknown keys are ignored.
Creating and editing them
The Run Configurations window (run.editConfigs, or Edit
Configurations… in the toolbar dropdown) is a master-detail editor for the
list, and
Run: Save Run Configuration… creates one from the palette;
Run: Run Configuration… runs one and Run: Delete Run Configuration…
removes one.
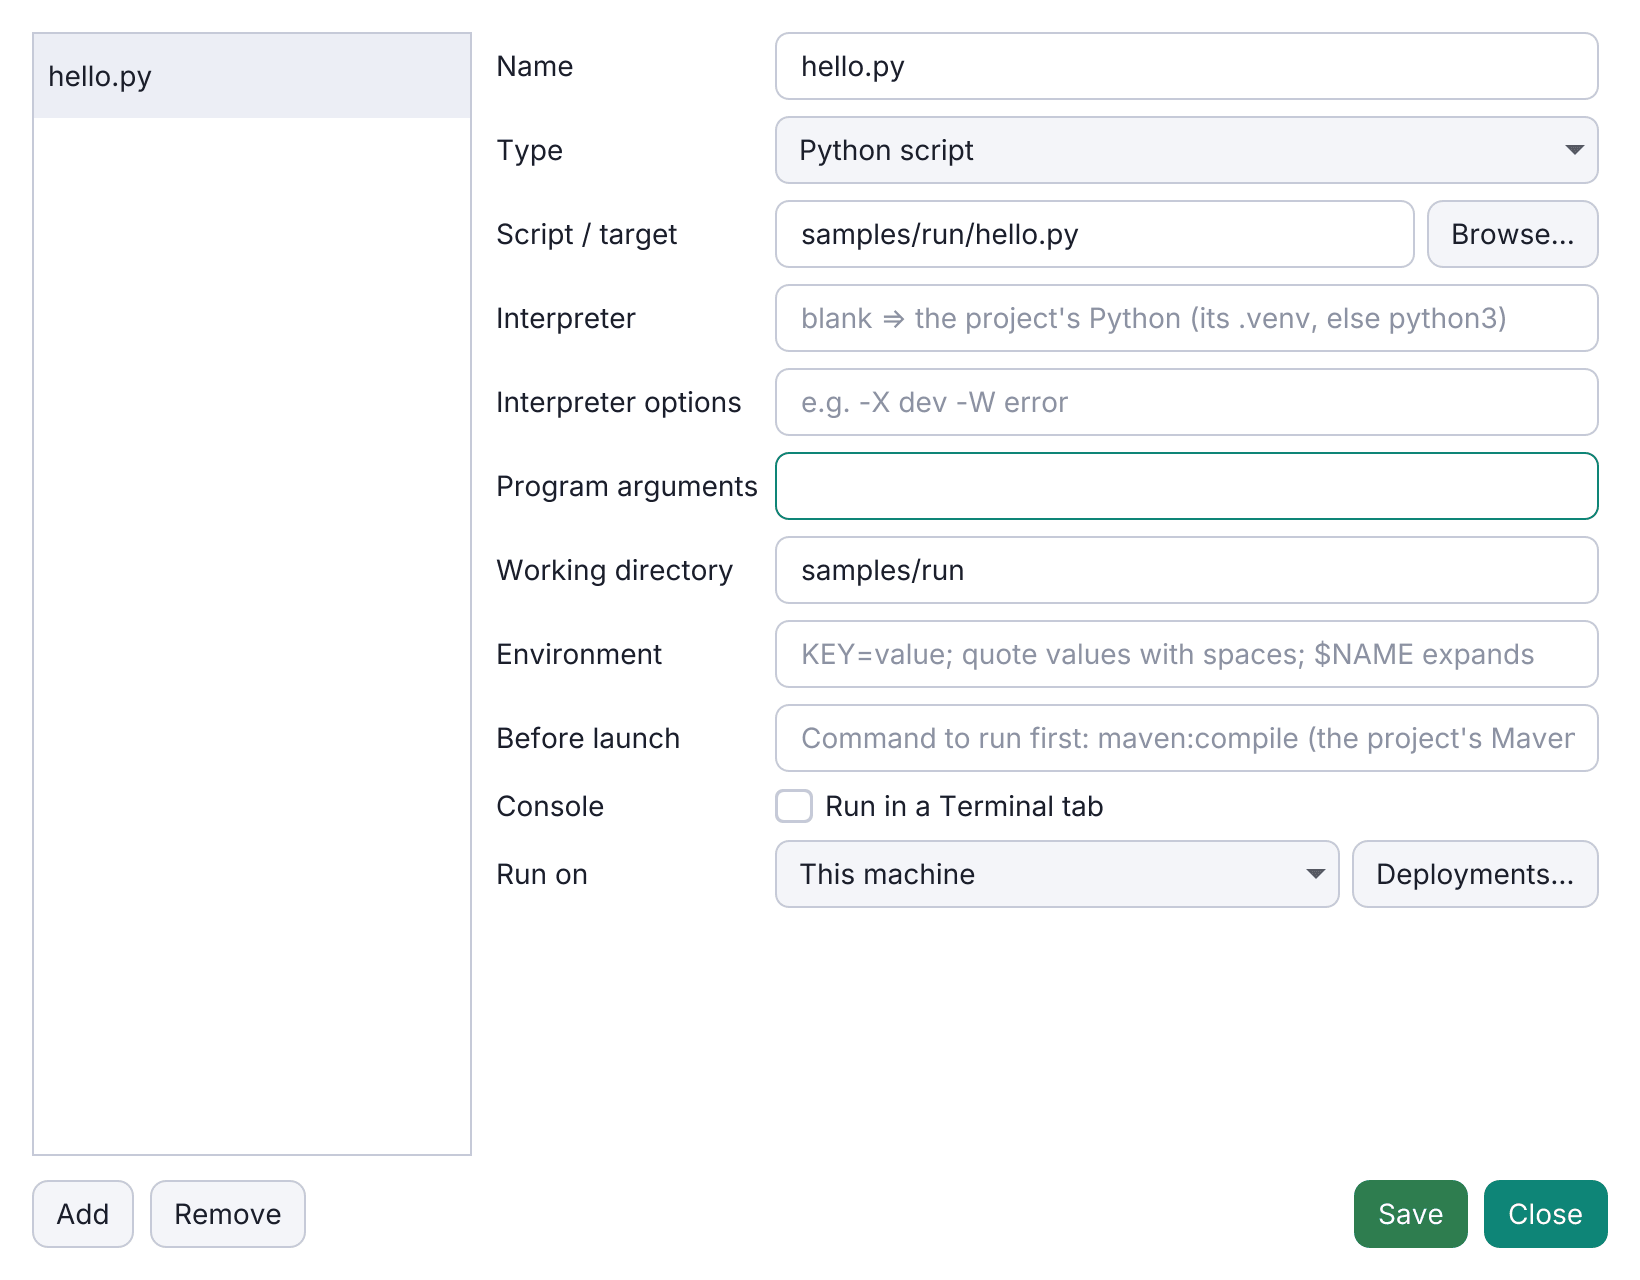
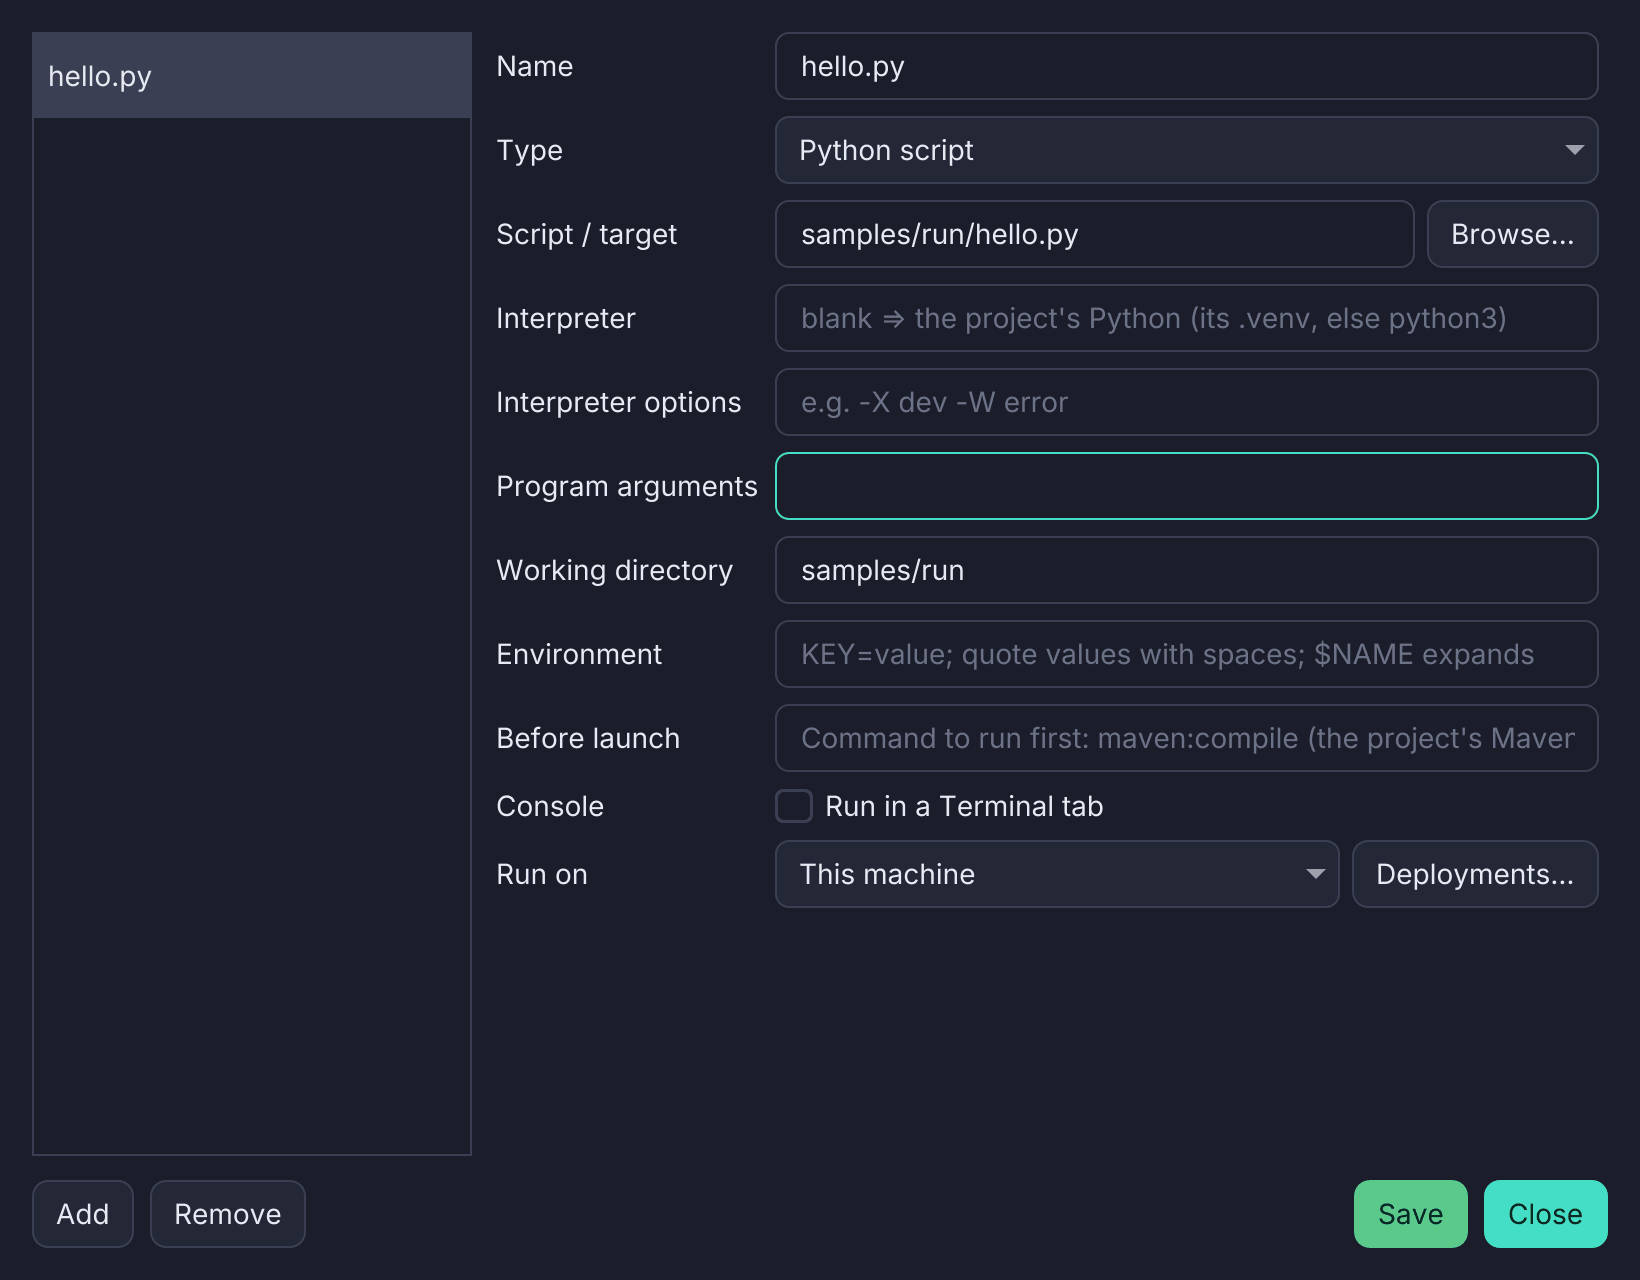
Add (run.addConfig) starts from the file you are looking at rather than a
blank entry. For an active Python, Node.js or shell script it adds a configuration
of that type for the script, named after the file; a C, C++, Go or Rust file gets
a configuration of its type too. With a makefile in front, Add makes a Make
target configuration, and with a package.json an npm script one, each set
to run in that file’s folder. A Python, shell, Node.js, Groovy, Kotlin, Scala or
Clojure file that is not saved yet gets a configuration of its type too, and a
file no type launches (a note, a C# file) gets a Java one. The Type box shows
each type with the icon its files carry in the tabs and the Project tree. For a Java file it
prefills the main class from the active Java file (or the one your Gradle build
declares as mainClass, mainClass.set(…), or the legacy mainClassName), names
the configuration after that class, and puts the cursor in whichever field still
needs you. Adding twice from the same file gets you “App” and “App (2)” rather
than two entries sharing a name.
Run: Save Run Configuration… saves the active Java file’s main class, or the active Python, Node.js or shell script, with the file’s program arguments. For a script, Add and Save write the folder its gutter ▶ runs it in into Working directory, so the configuration runs exactly as ▶ does. It is left blank when that folder is the project root, and for a Node.js script, which runs from its package folder.
Running an incomplete configuration opens its form at the field you need to fill in, rather than naming the problem and leaving you to find it. VM arguments and environment variables apply to both Run and Debug. Before a script configuration runs, Editora saves that script if it has unsaved edits in any tab.
A saved configuration does not depend on which tab is in front: any open Java file in the project serves, and it reports an error only when there isn’t one.
Debugging
Editora debugs Java, Python, JavaScript and TypeScript (Node.js),
Groovy, Kotlin, Clojure, Scala, Go,
Rust, C and C++,
C#, Ruby,
PHP and Bash through the Debug Adapter Protocol, with an IntelliJ-style Debug tool window (M-g d). Debugging
is on by default, and each language’s debugger starts once its adapter is
found (Installing adapters); the switch is Enable
debugging (DAP) in Settings → Debugging. A project’s
.vscode/launch.json configurations start as VS Code starts them
(launch.json configurations), and any other
debugger that speaks the protocol can be added
(Debug adapters of your own). Several programs
can be debugged at once, each in a session of its own
(Several sessions), and a compound starts
several together. Scripts of shells other than Bash, such as zsh or fish,
can’t be debugged; Run with Trace shows each line of a
script as it runs.
| Action | Command | Default key |
|---|---|---|
| Start / continue | debug.start | C-c C-d d |
| Continue | debug.continue | C-c C-d c |
| Pause | debug.pause | C-c C-d p |
| Stop | debug.stop | C-c C-d k |
| Stop every session (Several sessions) | debug.stopAll | (palette) |
| Restart | debug.restart | C-c C-d r |
| Step over | debug.stepOver | C-c C-d n |
| Step into | debug.stepInto | C-c C-d i |
| Step out | debug.stepOut | C-c C-d o |
| Step over / into one machine instruction (Disassembly) | debug.stepOverInstruction, debug.stepIntoInstruction | (palette) |
| Run to cursor | debug.runToCursor | C-c C-d u |
| Run to cursor past every breakpoint | debug.forceRunToCursor | C-c C-d S-u |
| Jump to line | debug.jumpToLine | C-c C-d j |
| Have Step Into go over a frame’s code (Don’t step into) | debug.dontStepIntoFrame | (palette) |
| Step back or reverse continue | debug.stepBack, debug.reverseContinue | (palette) |
| Have GDB record the program (Record Execution) | debug.toggleRecording | (palette) |
| Toggle breakpoint | debug.toggleBreakpoint | C-c C-b |
| Toggle temporary breakpoint | debug.toggleTemporaryBreakpoint | C-c C-d 1 |
| Toggle recording breakpoint | debug.toggleRecordingBreakpoint | (palette) |
| Toggle method breakpoint (Java) | debug.toggleMethodBreakpoint | C-c C-d S-m |
| Toggle field watchpoint (Java) | debug.toggleFieldWatchpoint | C-c C-d S-w |
| Toggle lambda breakpoint (Java, JavaScript, TypeScript) | debug.toggleLambdaBreakpoint | C-c C-d S-l |
| Edit breakpoint | debug.editBreakpoint | C-c C-d e |
| Add a logpoint | debug.addLogpoint | C-c C-d g |
| Add a triggered breakpoint that waits for another | debug.addTriggeredBreakpoint | (palette) |
| Put the caret line’s breakpoint in a group | debug.moveBreakpointToGroup | (palette) |
| Turn a group’s breakpoints on or off | debug.toggleBreakpointGroup | (palette) |
| Export or import breakpoints | debug.exportBreakpoints, debug.importBreakpoints | (palette) |
| Choose exception breakpoints | debug.toggleExceptionBreakpoints | (palette) |
| Stop on an exception of a type you name | debug.addExceptionBreakpoint | (palette) |
| Show the exception card again | debug.showException | (palette) |
| Debug the current file on its own, as Debug File does | debug.debugFile | (palette) |
| Debug a project main class | debug.mainClass | (palette) |
| Debug the main class the caret is on | debug.mainClassAtCaret | (palette) |
| Debug a saved run configuration | debug.config | (palette) |
| Start a launch.json configuration | debug.startConfiguration | (palette) |
| Start a compound | debug.startCompound | (palette) |
| Make or change the project’s compounds | debug.editCompounds | (palette) |
Open debug-adapters.json | debug.editCustomAdapters | (palette) |
| Debug via build tool | debug.viaBuild | (palette) |
| Attach to a running JVM or Node.js | debug.attach | C-c C-d a |
| Attach to a program on this machine (Attach to Process) | debug.attachToProcess | (palette) |
| Attach again to the last address | debug.reattach | C-c C-d S-a |
| Open a core dump | debug.openCoreDump | (palette) |
| Open the Evaluate window | debug.evaluate | C-c C-d x |
| Go to the evaluate field in Variables | debug.focusEvaluate | (palette) |
| Pin a value to the caret’s line (pinned values) | debug.pinValue | (palette) |
| Unpin the values on the caret’s line | debug.unpinLine | (palette) |
| Show numbers as hexadecimal | debug.toggleHex | (palette) |
| Show one number in another base (Show Value As) | debug.showSelectedAsHex, debug.showSelectedAsDecimal, debug.showSelectedAsBinary, debug.showSelectedAsOctal, debug.showSelectedAsCharacter, debug.showSelectedAsDefault | (palette) |
| Show values without your type renderers | debug.muteRenderers | (palette) |
| Show every thread (Threads view) | debug.threads | (palette) |
| Hide or list the Go runtime’s goroutines, or filter them (Goroutines) | debug.toggleRuntimeGoroutines, debug.filterGoroutines | (palette) |
| Take a thread dump | debug.threadDump | (palette) |
| Draw every thread’s stack as one tree (Parallel Stacks) | debug.parallelStacks | (palette) |
| Go back or forward through earlier stops (Debug History) | debug.historyBack, debug.historyForward | (palette) |
| List the stops of the session | debug.showHistory | (palette) |
| Show the Disassembly or Memory view | debug.showDisassembly, debug.showMemory | (palette) |
| List the program’s loaded sources or modules | debug.loadedSources, debug.modules | (palette) |
| Turn the Python, JavaScript, Go, Rust, C and C++, C#, Ruby, PHP or Bash debugger on or off | debug.toggleAdapter | (palette) |
| Set an adapter’s path | debug.setAdapterPath | (palette) |
| Change a setting of Settings → Debugging | debug.changeSetting | (palette) |
The keys are the Emacs keymap’s; the other keymaps’ keys are listed under Debugger keys. The step commands are also buttons in the Debug window, and most debugger actions are in the Run menu. Its top level has Start / Continue, Debug Main Class, Attach, Stop, Stop All and Restart. The rest is in four submenus:
- Launch and Attach: Run and Debug Selected Configuration (
run.selectedConfig,debug.selectedConfig), Start Configuration, Start Compound, Edit Compounds, Attach to Process, Reattach, Open Core Dump, Debug in Browser and Attach to Browser. - Stepping: Pause, stepping by line or by instruction, Run to Cursor, Force Run to Cursor, Restart Frame, Don’t Step Into This, and Record Execution, Step Back and Reverse Continue.
- Breakpoints: Toggle Breakpoint and the other kinds of breakpoint (with logpoints and triggered breakpoints), Edit Breakpoint, the breakpoint list, groups, export and import, Mute Breakpoints, the exception breakpoints and Add Exception Breakpoint.
- Debugger: Apply Code Changes, evaluate, watches, pinned values, hexadecimal values, Mute Type Renderers, Show Exception, Debug History, the Threads view, Thread Dump, Parallel Stacks, the Loaded Sources, Modules, Disassembly and Memory views, and Edit Debug Adapters.
Jump to Line moves the program to another line without running the code in between. It needs a debugger that can do that: Python’s debugpy can. The Java and JavaScript debuggers cannot, and Jump to Line then says it is not supported.
Force Run to Cursor runs to the caret line as Run to Cursor does, but no
breakpoint or logpoint on the way stops it, in any file. Exception breakpoints
still stop the program. The breakpoints are back at the next stop, wherever
that is: the caret line, an exception, or Pause. Its keys are C-c C-d S-u in
the Emacs keymap and Ctrl+Alt+F9 (⌥⌘F9 on macOS) in the IntelliJ IDEA keymap;
it is also in Run ▸ Stepping and, while the program is paused, in the
editor’s right-click menu.
While the program is paused, pointing at a line number turns it into an arrow, and its tooltip names the line: click it to run to that line, as Run to Cursor does, or Shift+click it to get there past every breakpoint on the way, as Force Run to Cursor does.
After a step or Continue, the time the program ran until it stopped appears faintly after the line it stopped on, as Visual Studio’s PerfTips show it. Show how long each step took, at the top of Settings → Debugging (on by default), turns it off.
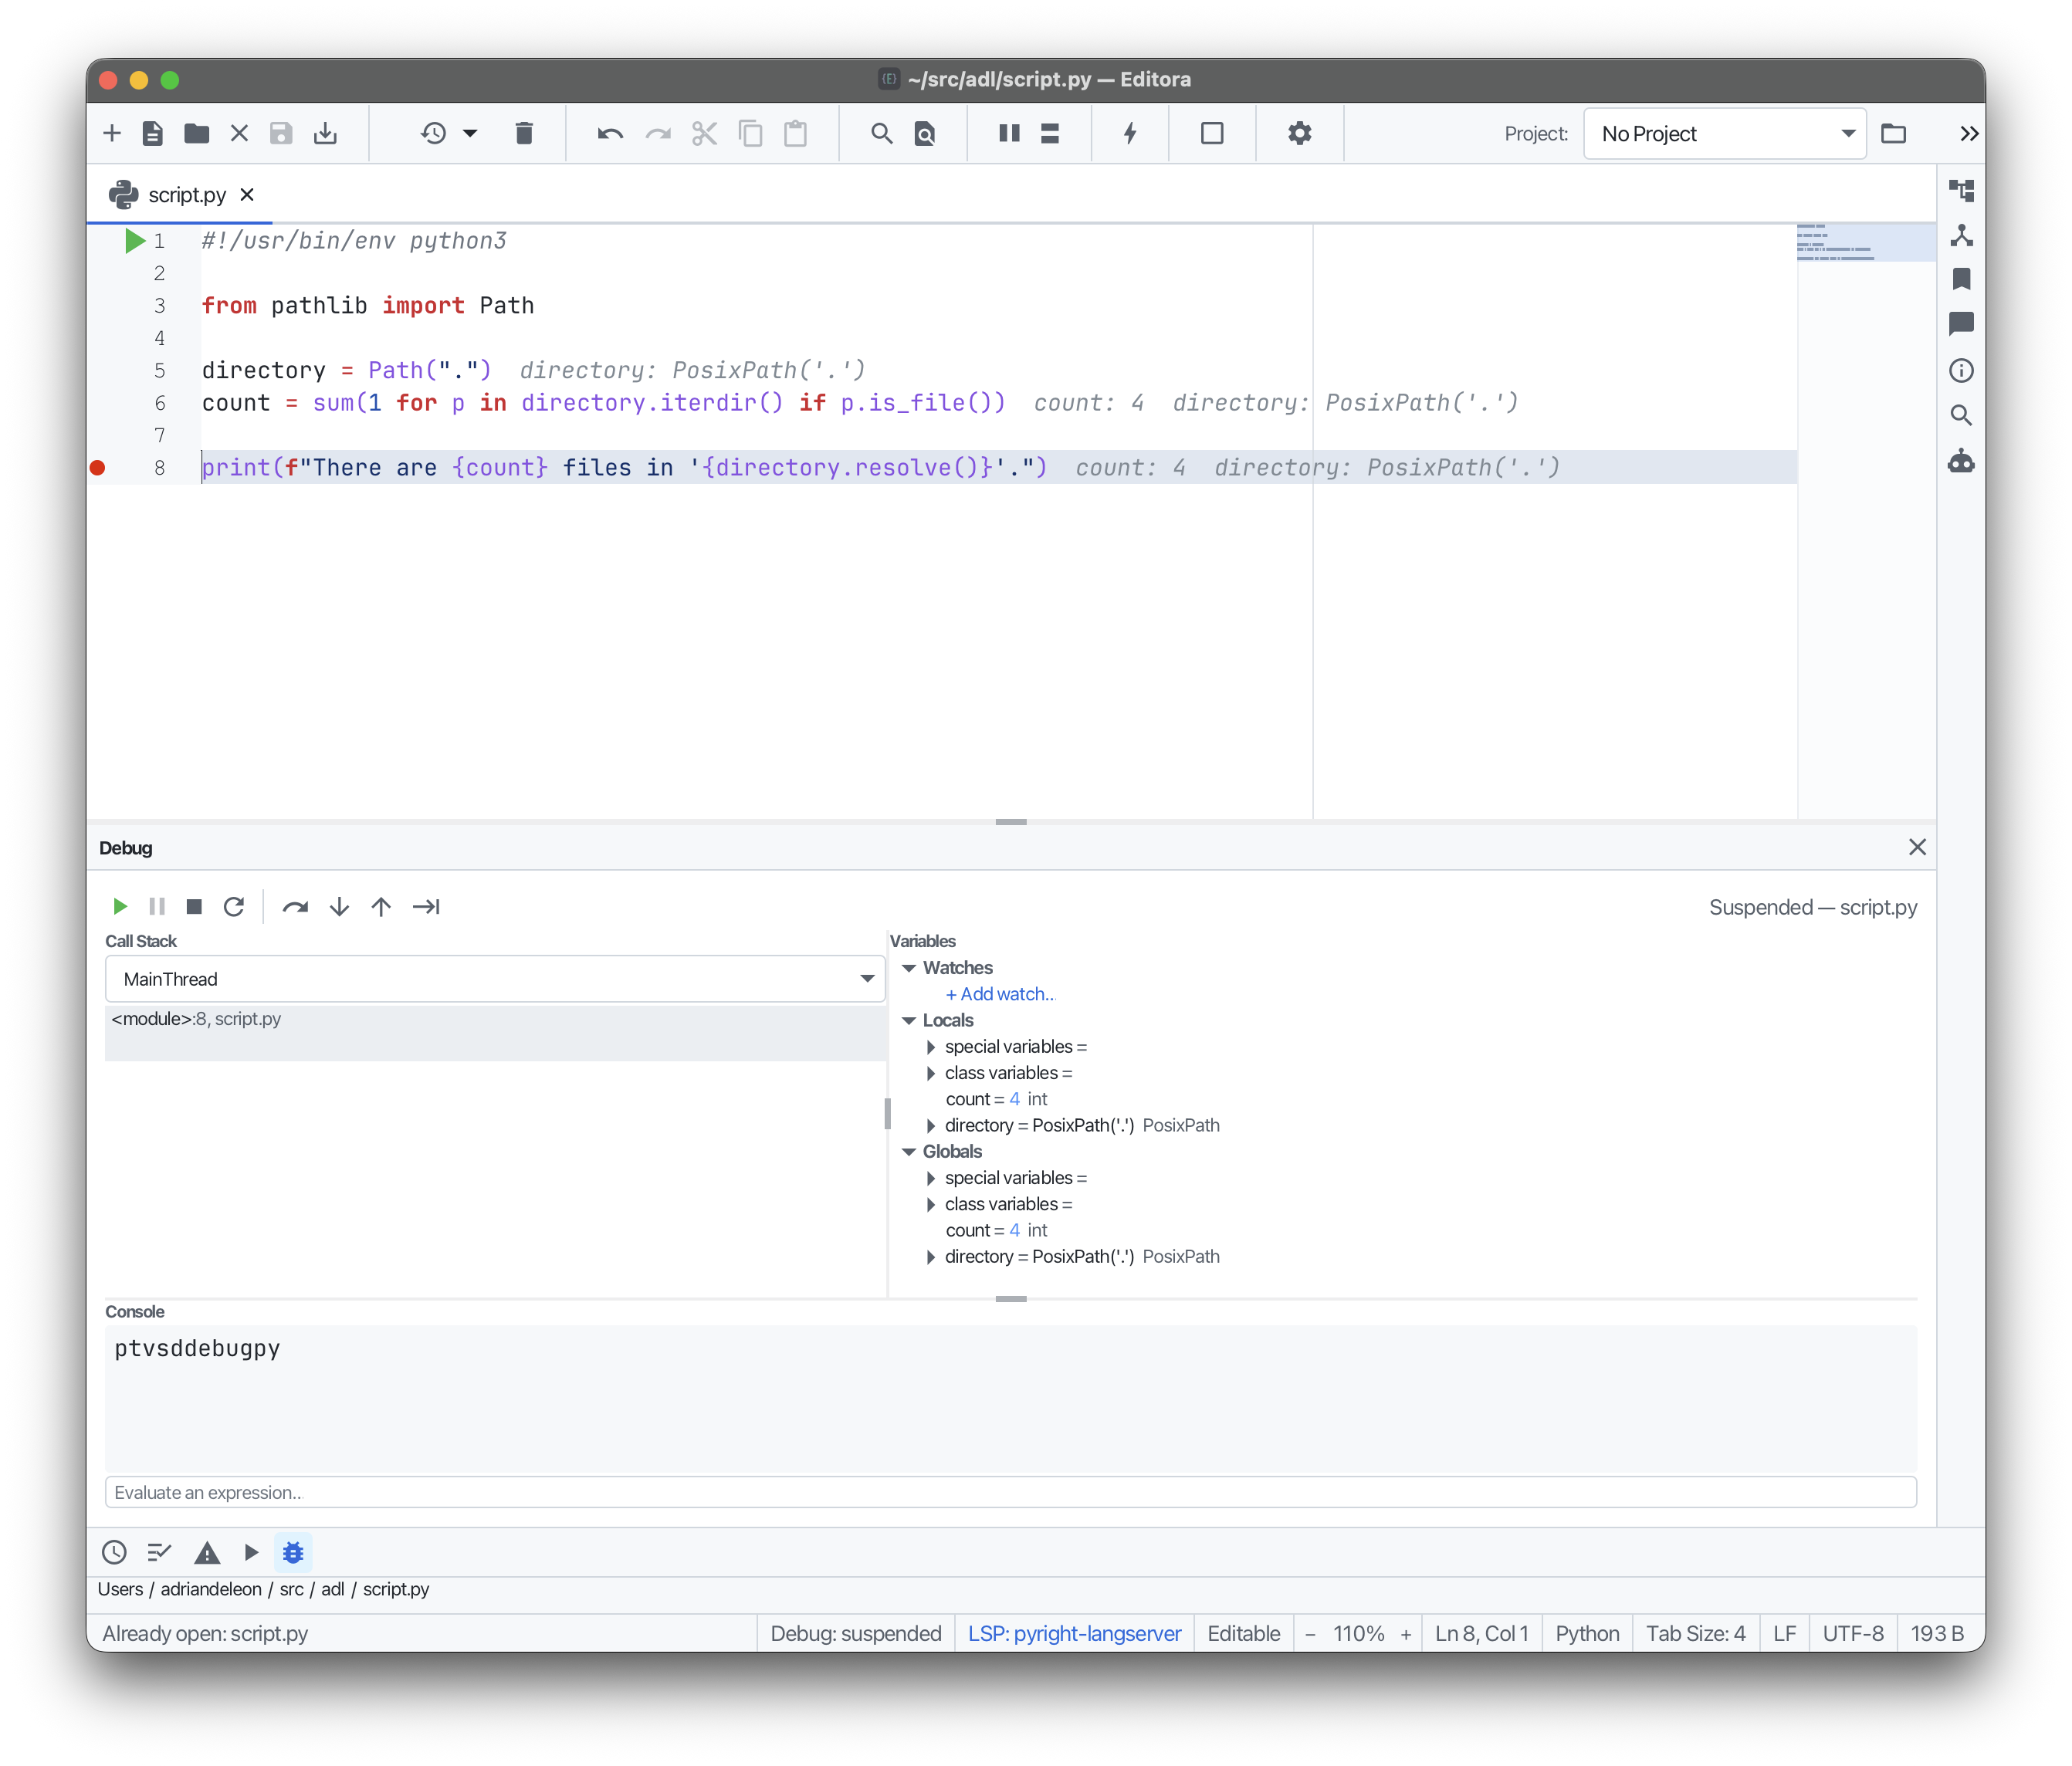
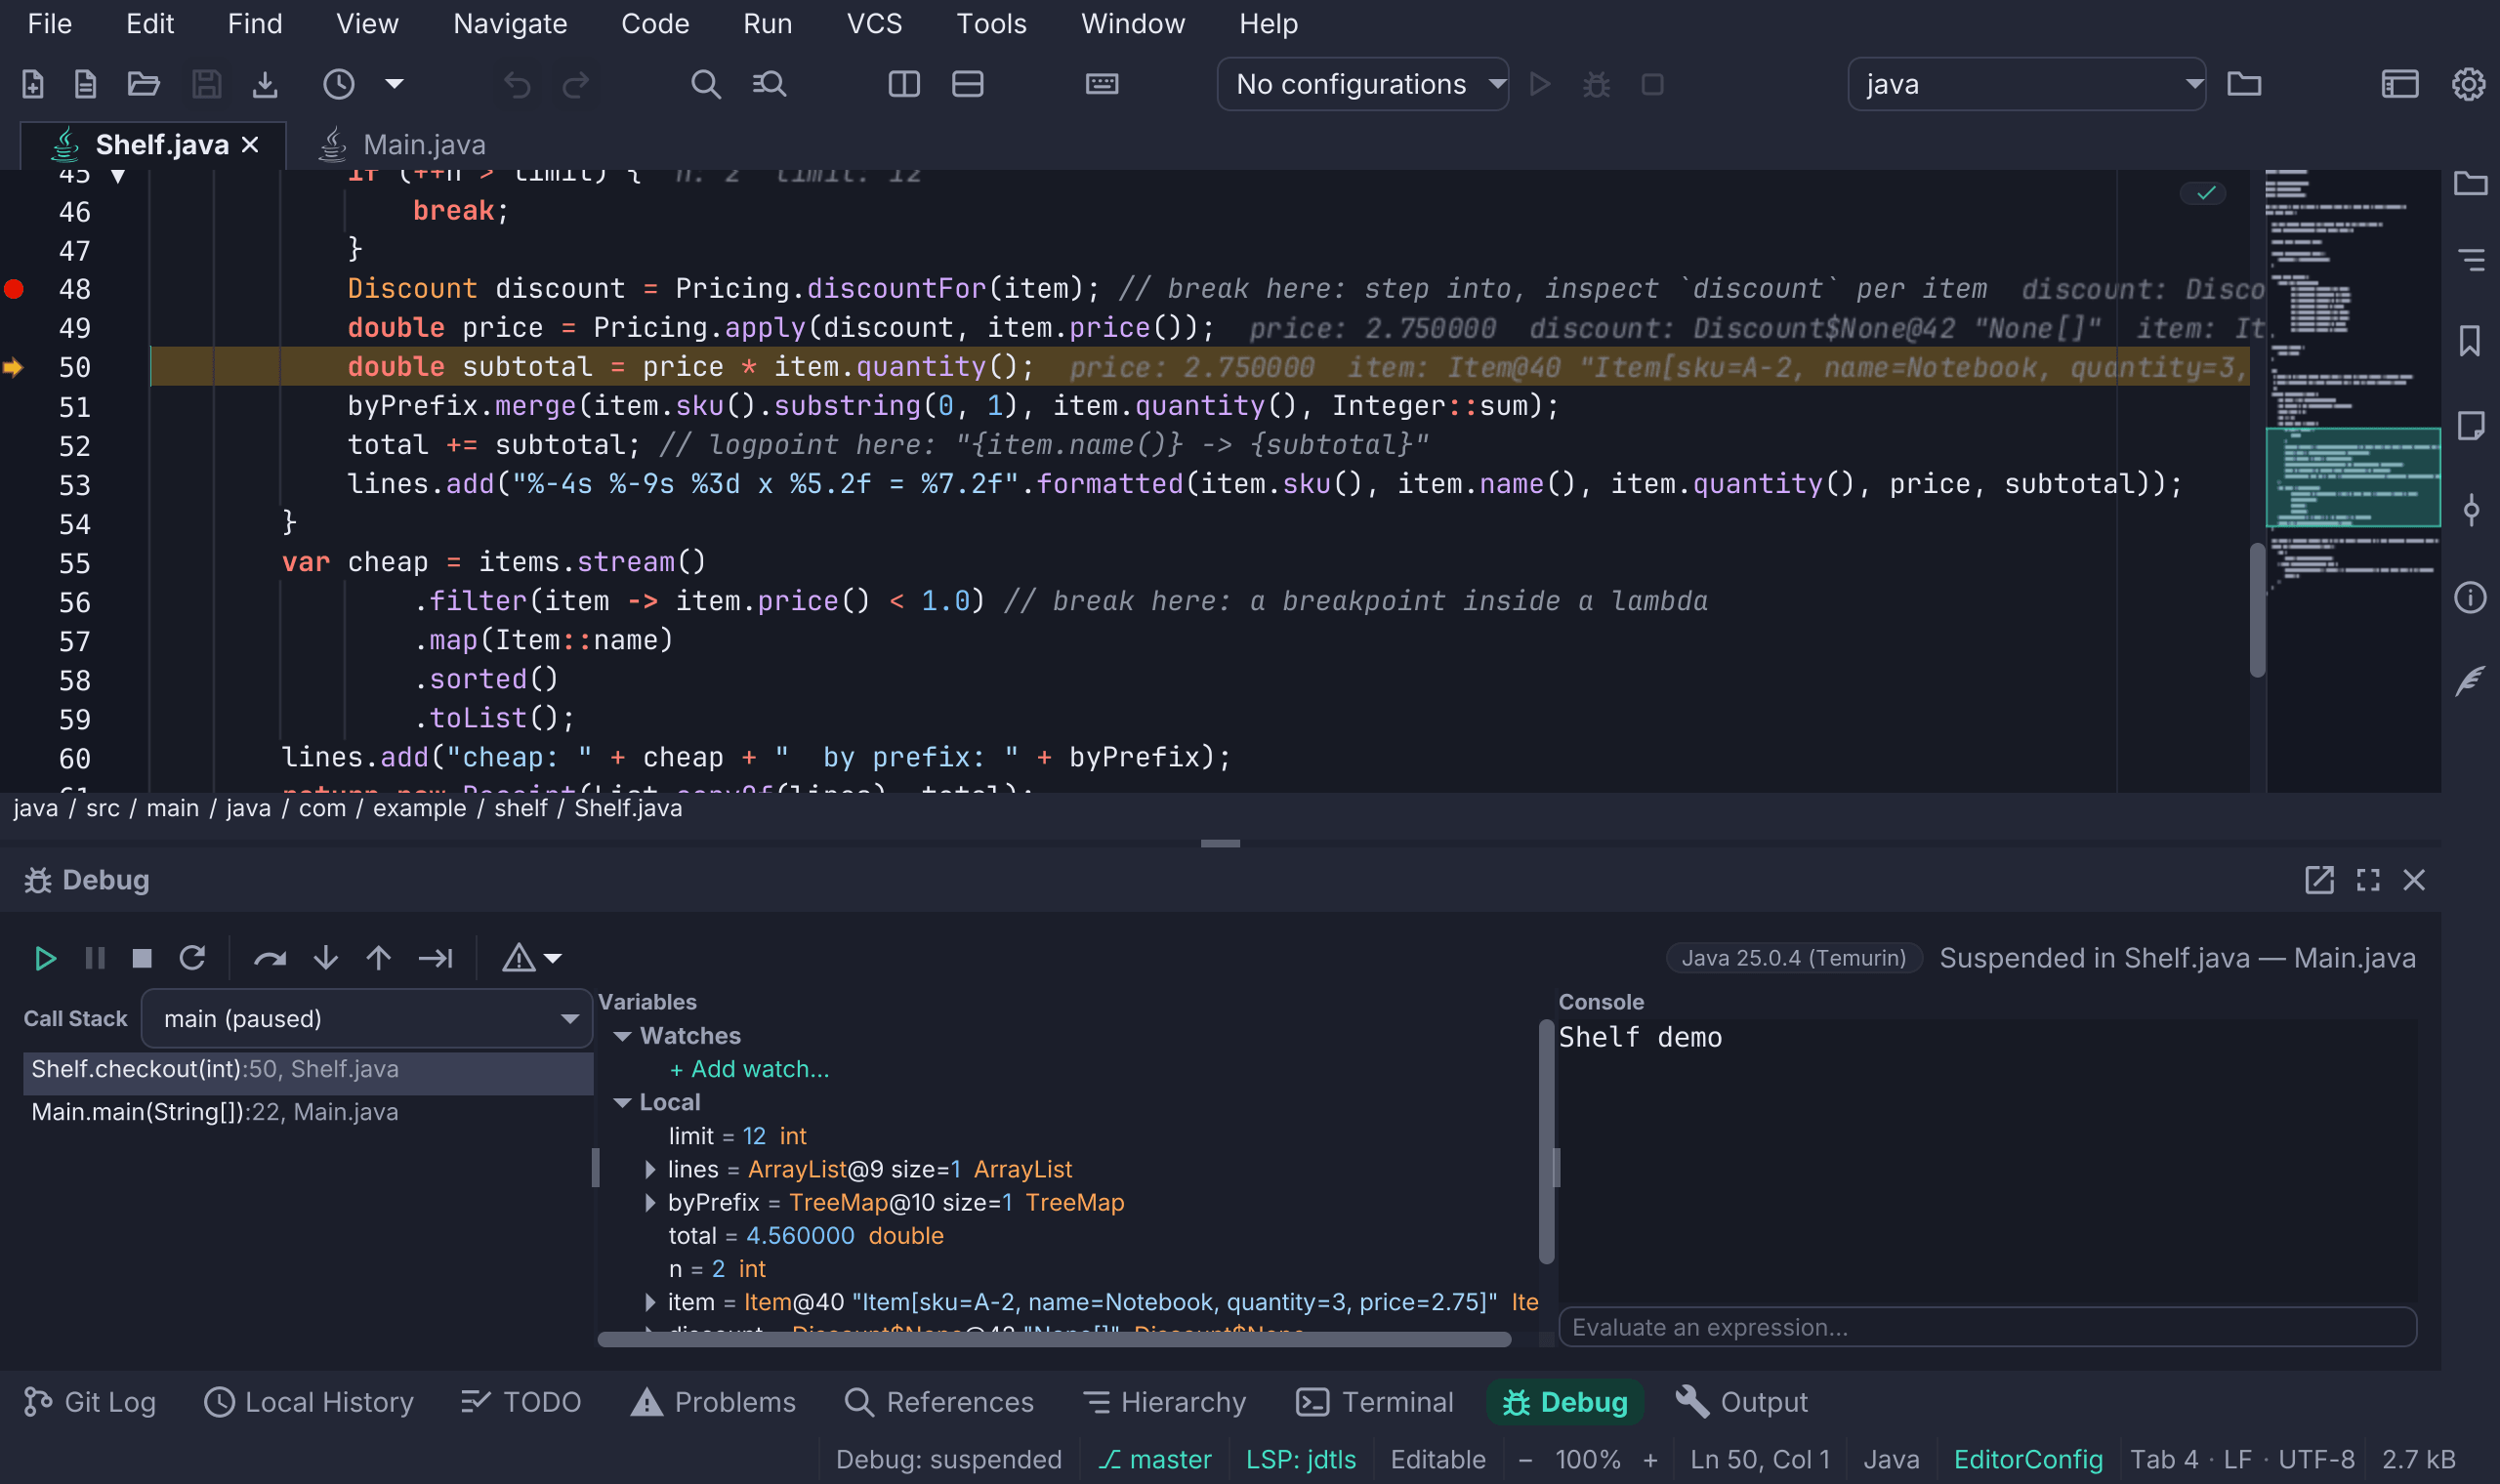
The Debug window has a threads and call-stack view, a lazy variables tree with
set-value, watches, an evaluate field and a
console. While suspended, inline
values appear after each line and hovering a variable shows its value.
Hovering an attribute shows the whole expression: the x of p.x shows
p.x, not a variable named x. Hovering stops at a call or an index, so it
never runs code.
In Variables and watches, each row’s name, value and type are coloured like
code in the current editor theme: strings, numbers, constants such as true,
null and None, and type names, including each element of a list or dict
value. A watch that cannot be evaluated shows the debugger’s message in red
italics instead.
Breakpoints live in a leftmost gutter strip and are saved per project.
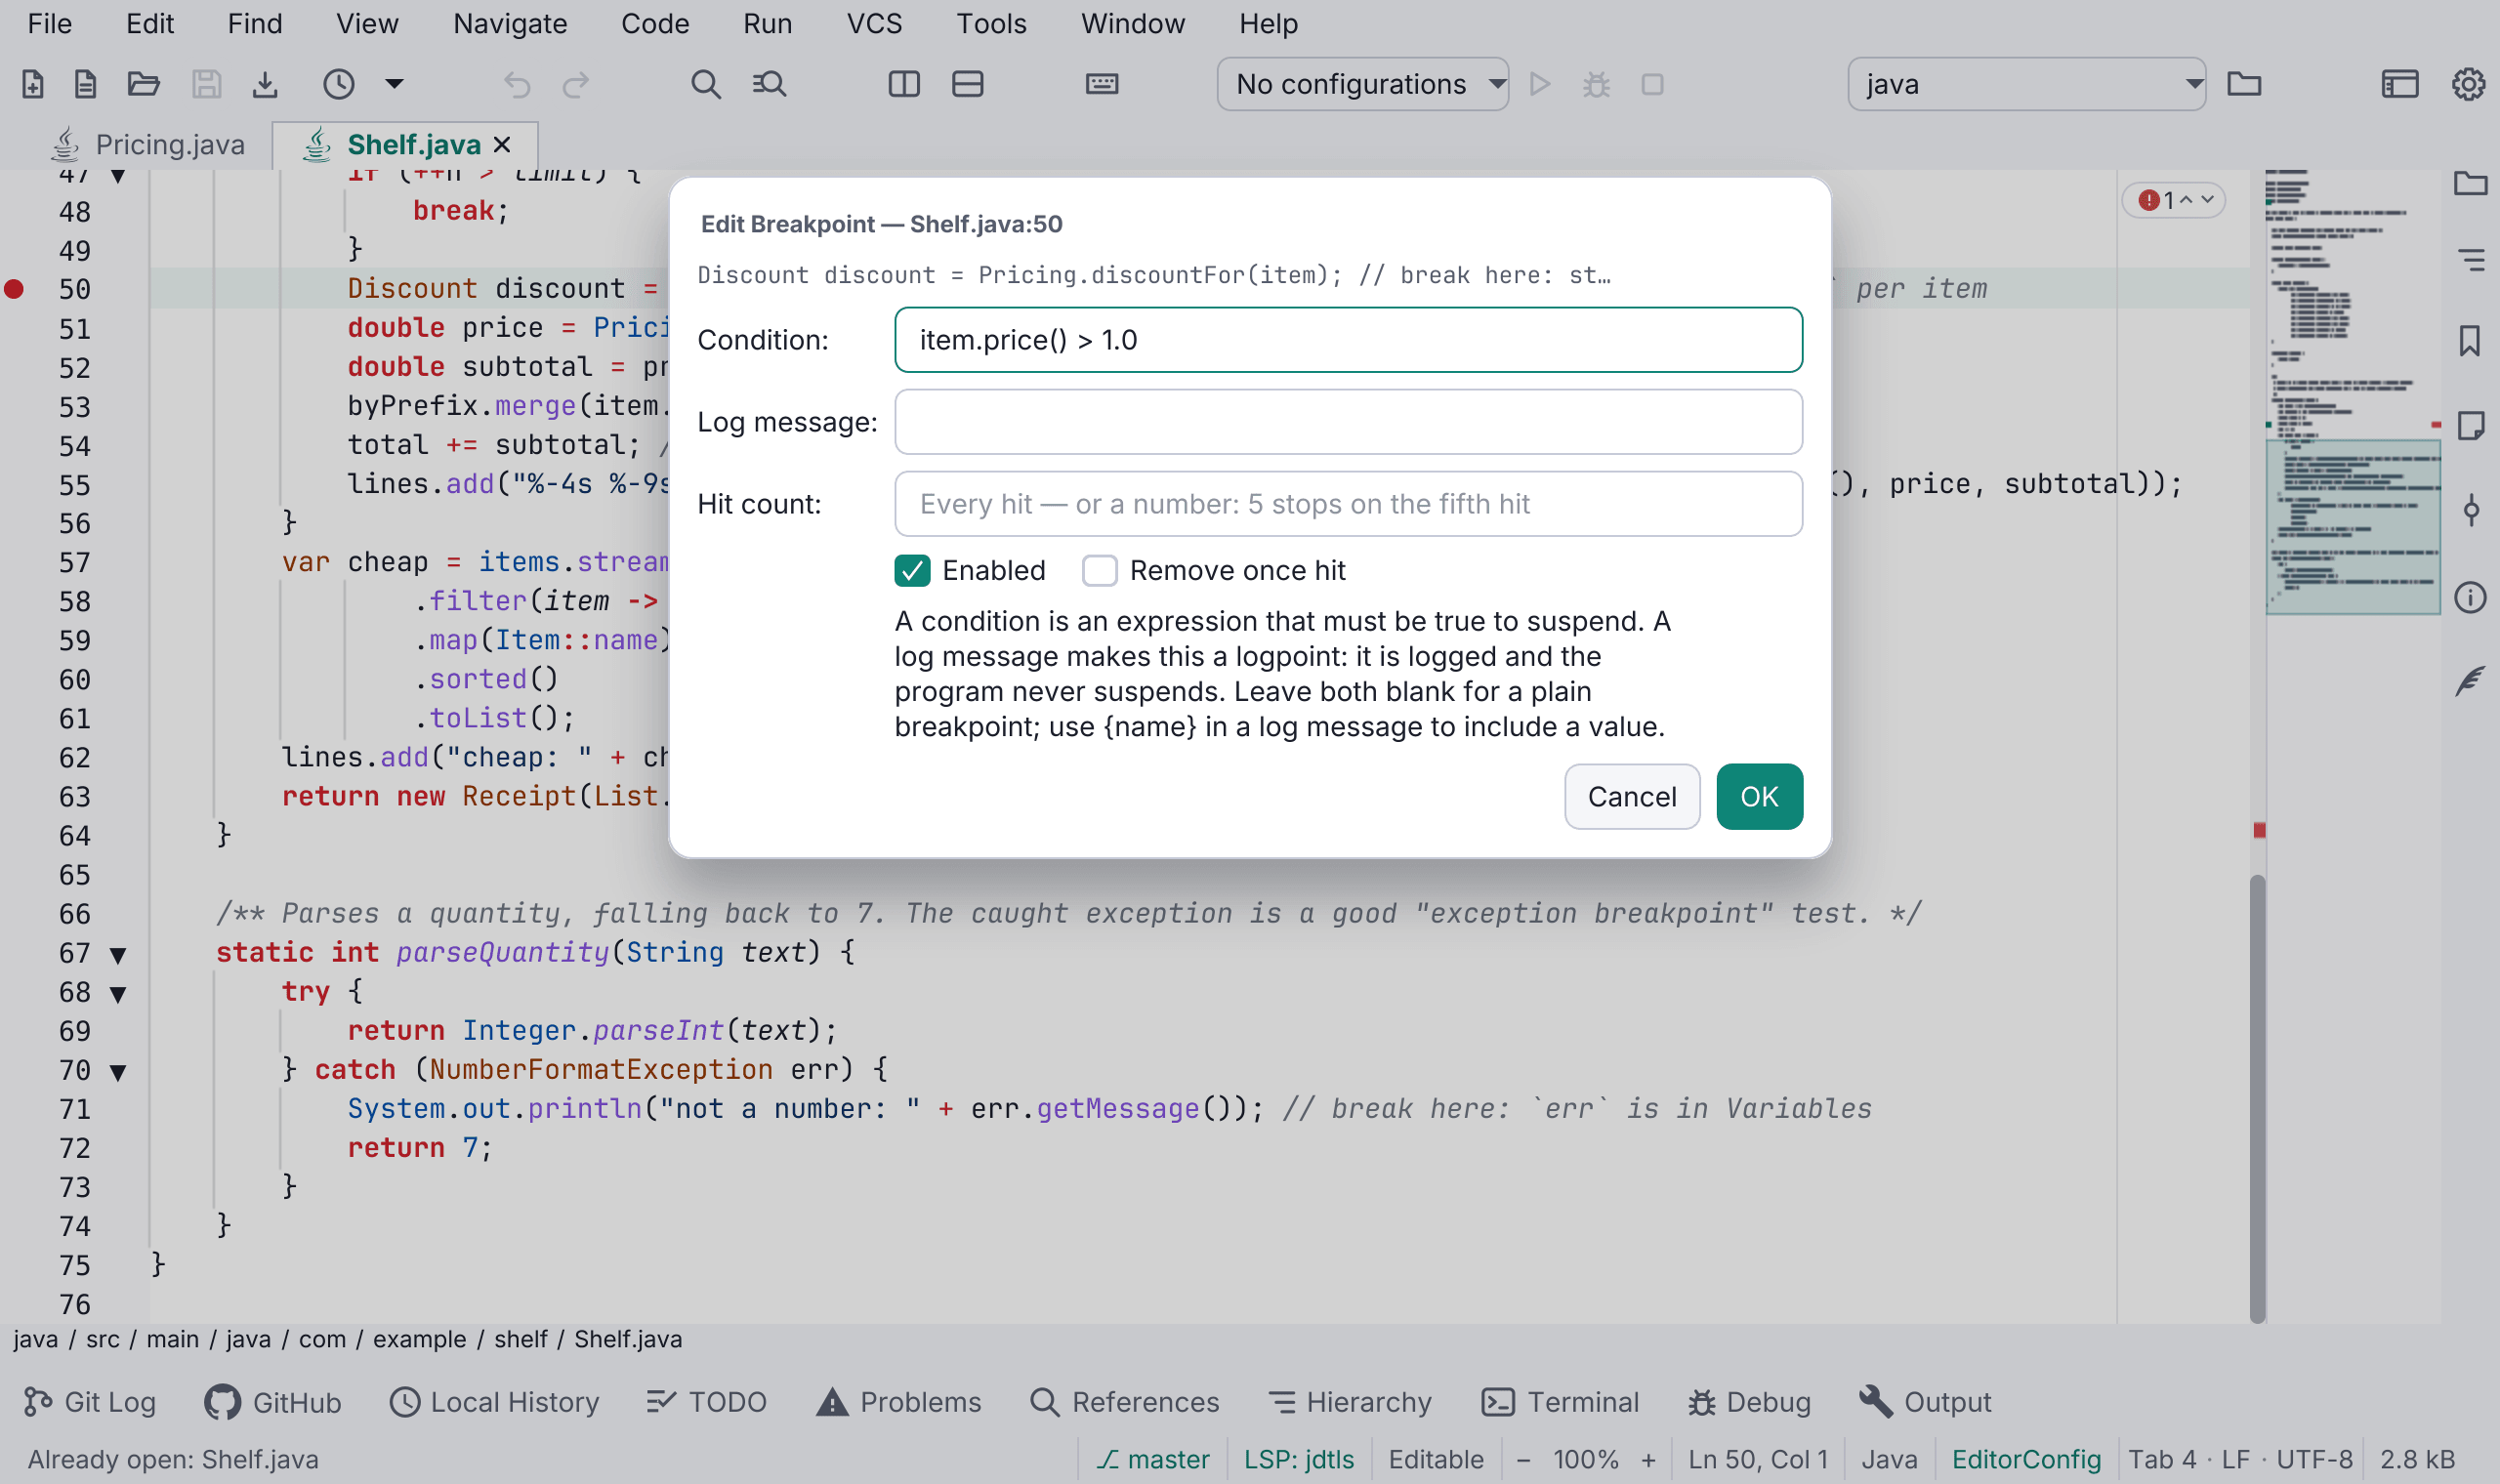
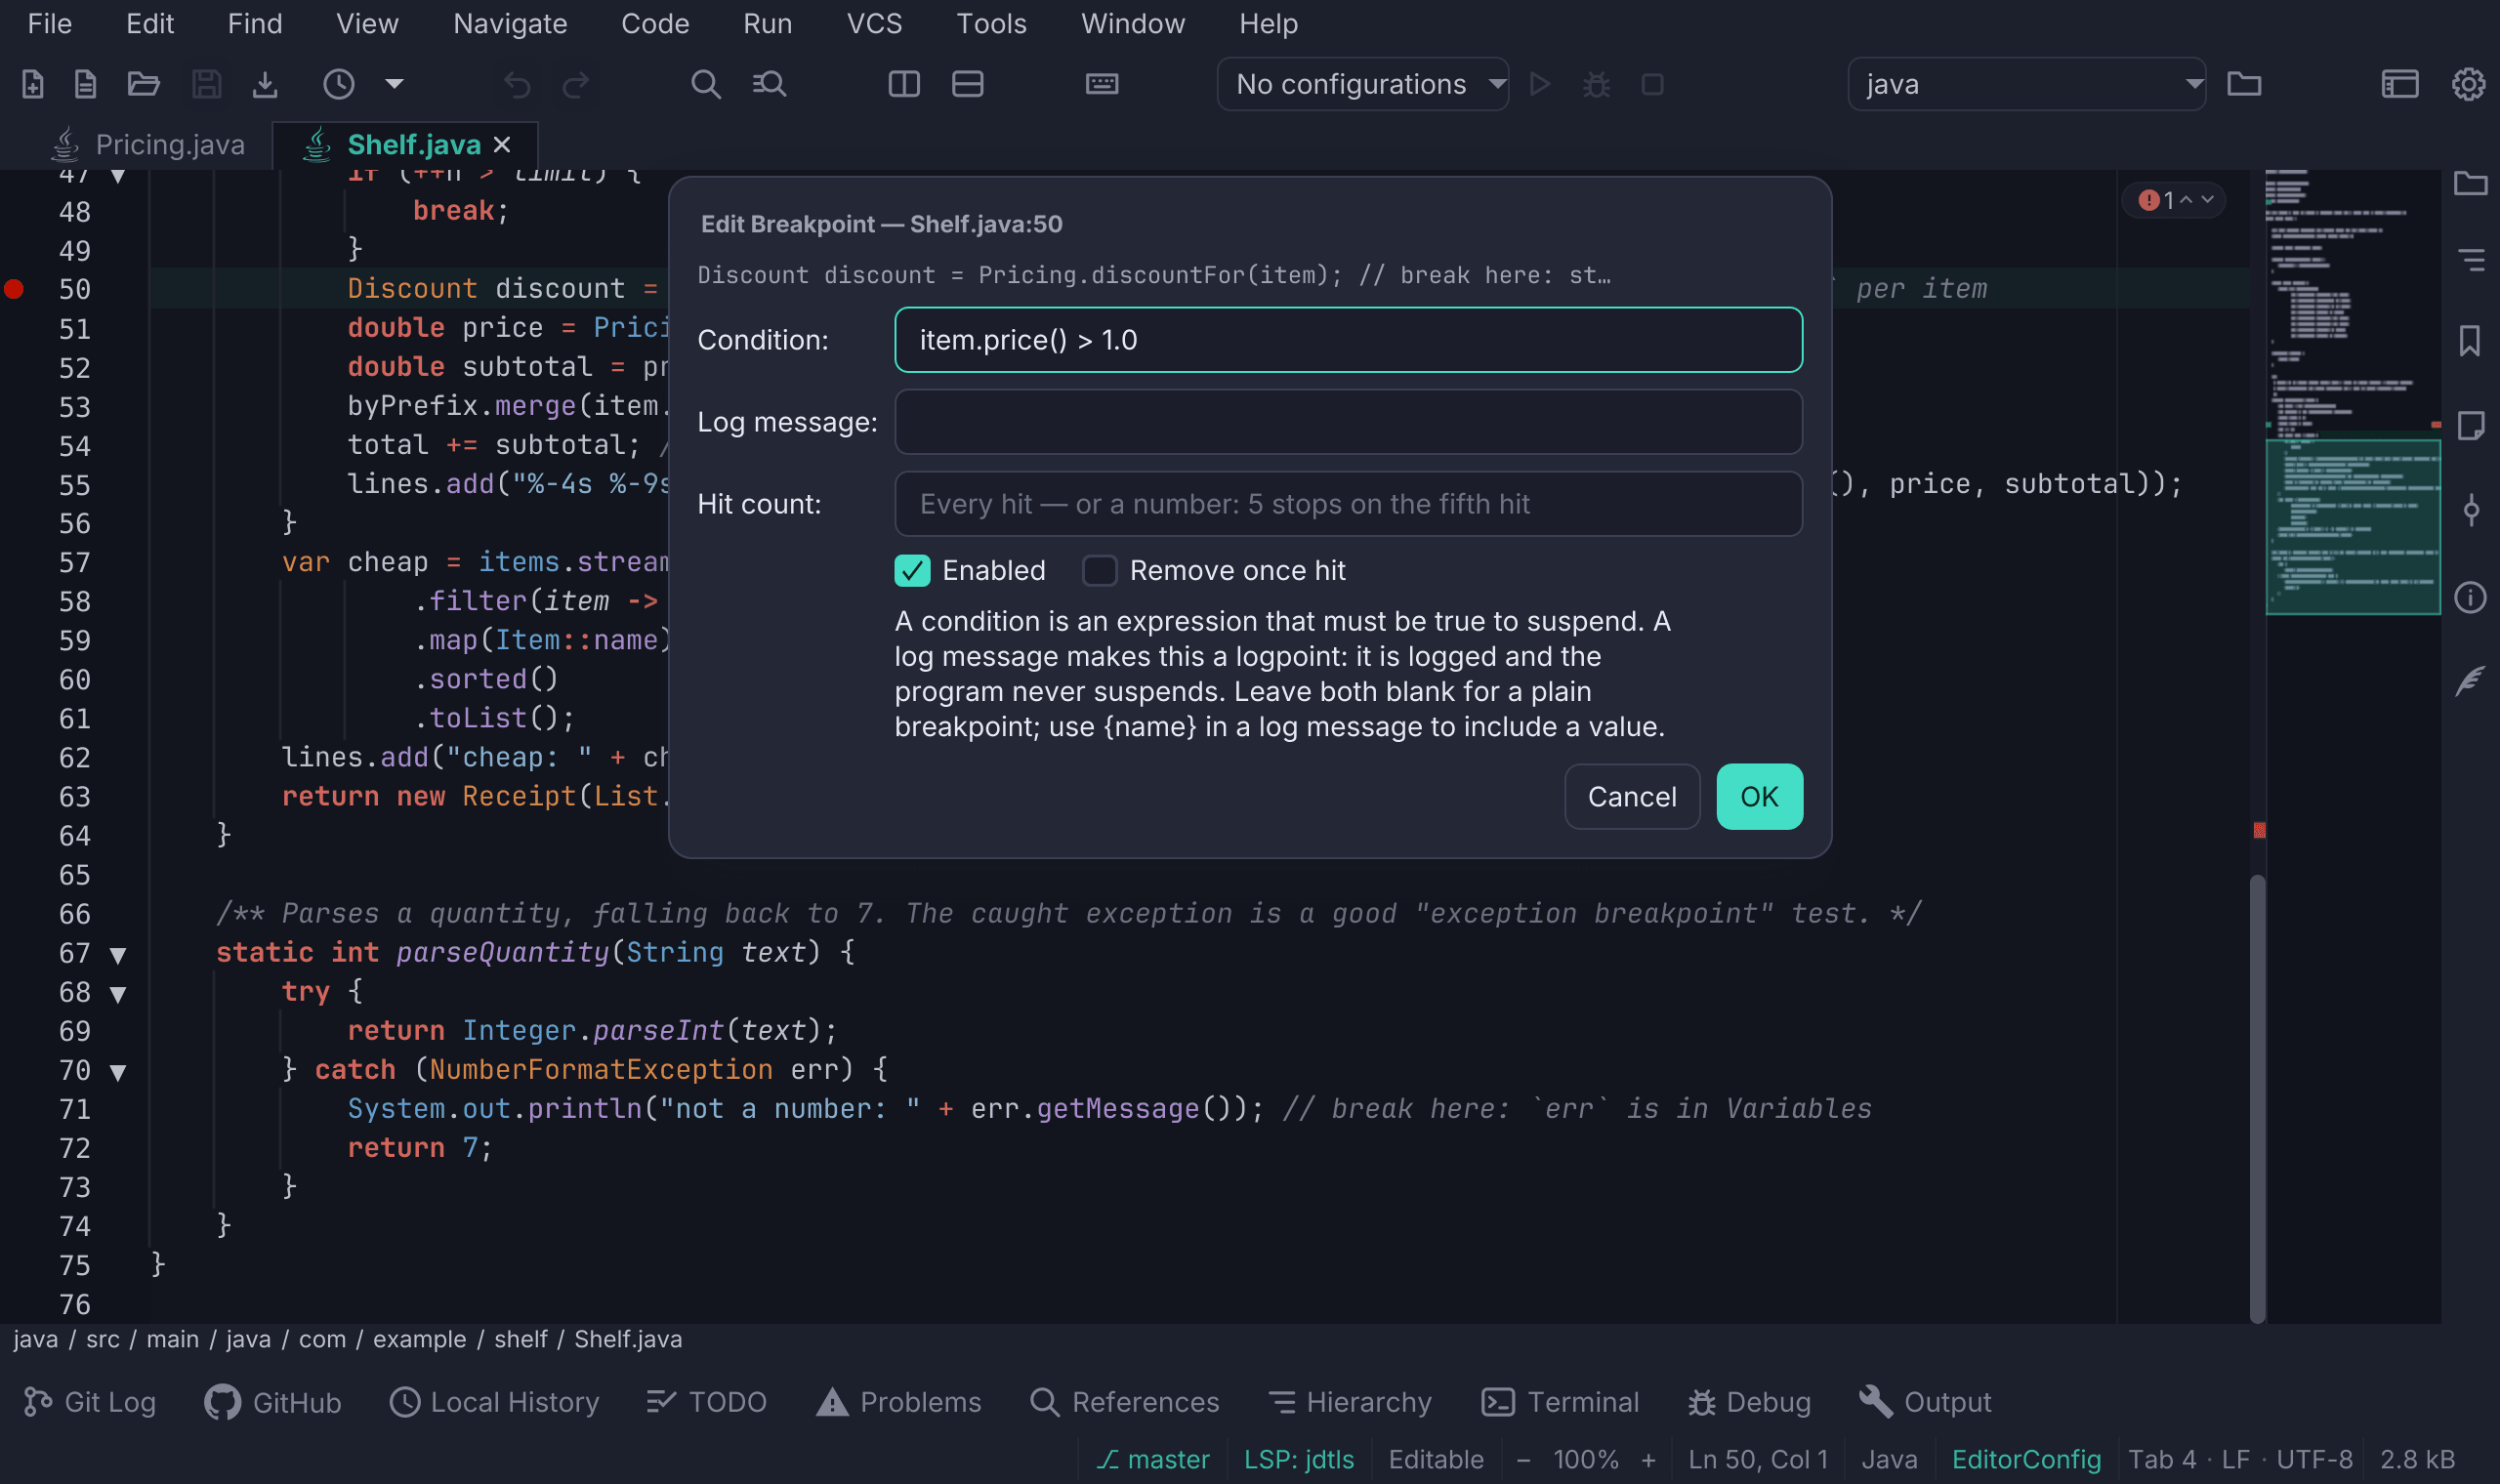
Edit Breakpoint is a form with a condition, a hit count, a log
message (which turns it into a logpoint that logs and never suspends), an
Enabled toggle, Remove once hit, which makes it a
temporary breakpoint, Record and continue,
which makes it a recording breakpoint, Wait for,
which makes it a triggered breakpoint,
Group, which puts it in a group, and three
filters that limit it to some threads, callers or one
object. Its title names the file and line, such as Edit
Breakpoint — Main.java:27, and the line’s code is shown above the fields, since
the form can cover that line. The hit count makes it stop only on that hit: 5
stops on the fifth. Python also takes forms such as >= 3 or % 2; the other
debuggers take only a number, and the field’s hint says which. A breakpoint
with a condition or a hit count is drawn as conditional. Breakpoints in closed
files are honored too.
The debugger may set a breakpoint on another line than the one you chose: in Python, a breakpoint on a blank or comment line goes to a nearby line with code. The breakpoint then moves to that line, and the status bar says so. If that line already has a breakpoint, the moved one is removed and the one already there, with its condition, is kept.
While a session runs, a breakpoint the debugger has not verified (its code is not loaded yet, or the line has no code) is drawn as a hollow ring, with the debugger’s explanation on hover. Every breakpoint is hollow from the start of the session until the debugger answers, and the markers return to normal when the session ends.
When the panel is wide enough, the call stack, variables, and console sit side
by side; they stack when it is narrow. The call stack lists the innermost 1,000
frames when the adapter supports partial stacks. The console wraps long lines.
It is cleared at each launch and kept after the session ends, and its
right-click menu has Clear Console. Your keymap’s Find key in the console,
or Debug: Find in Console (debug.findInConsole) from anywhere, opens a
find bar over it that searches as you type: Enter goes to the next match,
Shift+Enter to the previous one, and running the command again goes to the
next match too. It keeps the last 200,000 characters;
when older output was dropped, the Debug window’s state line says so. Restart is disabled for a debugger attached to a test or build
run (its tooltip says why); a session started with Debug → Attach can still be
restarted.
A spinner beside the Debug window’s status turns while the before-launch build, the session start, or the program is running, and stops while the program is paused (at a breakpoint, a step, or Pause). Pause works only on a running program, so it is greyed out while the program is paused, starting or being built. In Java, Pause stops every thread of the program, and Continue resumes them all (see Threads in a Java program).
Beside that status, the Debug window names the runtime the debugged program runs under, as the Run window does: the JDK of a Java launch, the Python that debugpy runs the script with, or the Node.js of a JavaScript launch. The name clears when the session ends. A session started with Debug → Attach shows none, because the program was already running.
When a file cannot be debugged, the status bar says why and what to do: Python or JavaScript debugging is turned off, debugpy was not found for the Python interpreter, or vscode-js-debug or Node.js was not found.
Several sessions
Editora can debug several programs at once, each in a session of its own: a server and its client, or a program and one of its tests. Start debugging another file while a session runs, with F5, Debug File or Debug Test at Caret, and Editora asks what to do:
- Debug Both debugs the new file in a session of its own, beside the one that runs.
- Stop and Debug stops the session and debugs the new file instead.
- Cancel leaves things as they are.
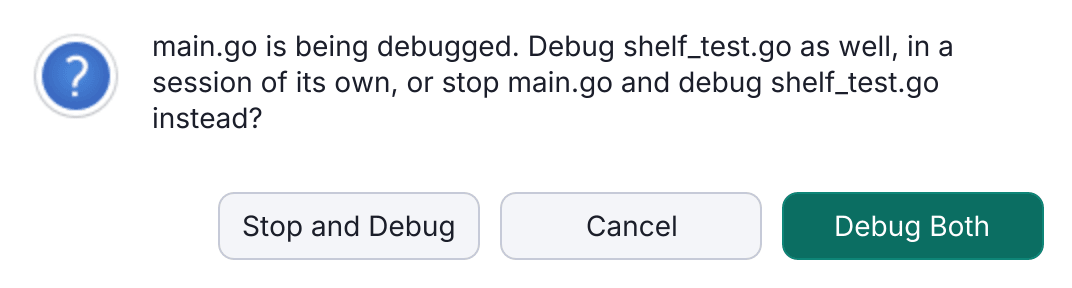
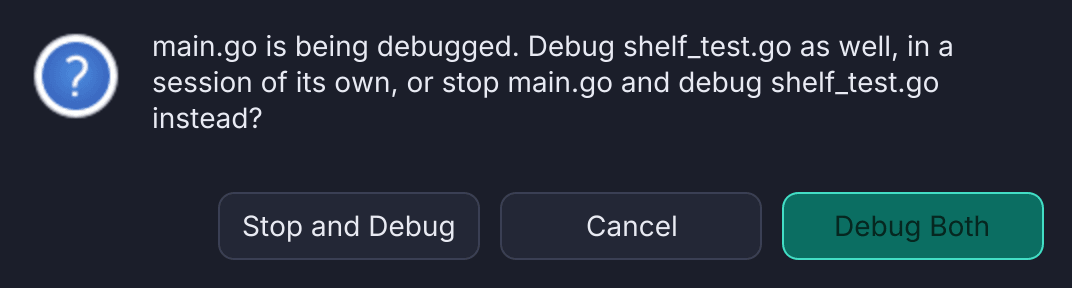
While a session is paused, F5 continues it instead of asking, so start another file then with Debug File or Debug Test at Caret. Debug Both is offered beside a session that has started: while one is still getting ready (its build, say), the question has Stop and Debug and Cancel only. Asking to debug a file that a session already debugs starts nothing: that session is shown, and the status bar says so.
With two sessions or more, a row of tabs at the top of the Debug window has one tab per session, with its file (or its test) and its state, such as main.go · suspended. Click a tab to show that session. Each session has its own console, call stack, variables and Debug History. The toolbar, the debugger keys, the execution line, inline values and hovers follow the session shown. A session that stops is shown by itself, so you see where it stopped; a stop on a recording breakpoint doesn’t switch. Breakpoints, Mute, exception breakpoints and hexadecimal values apply to every session.
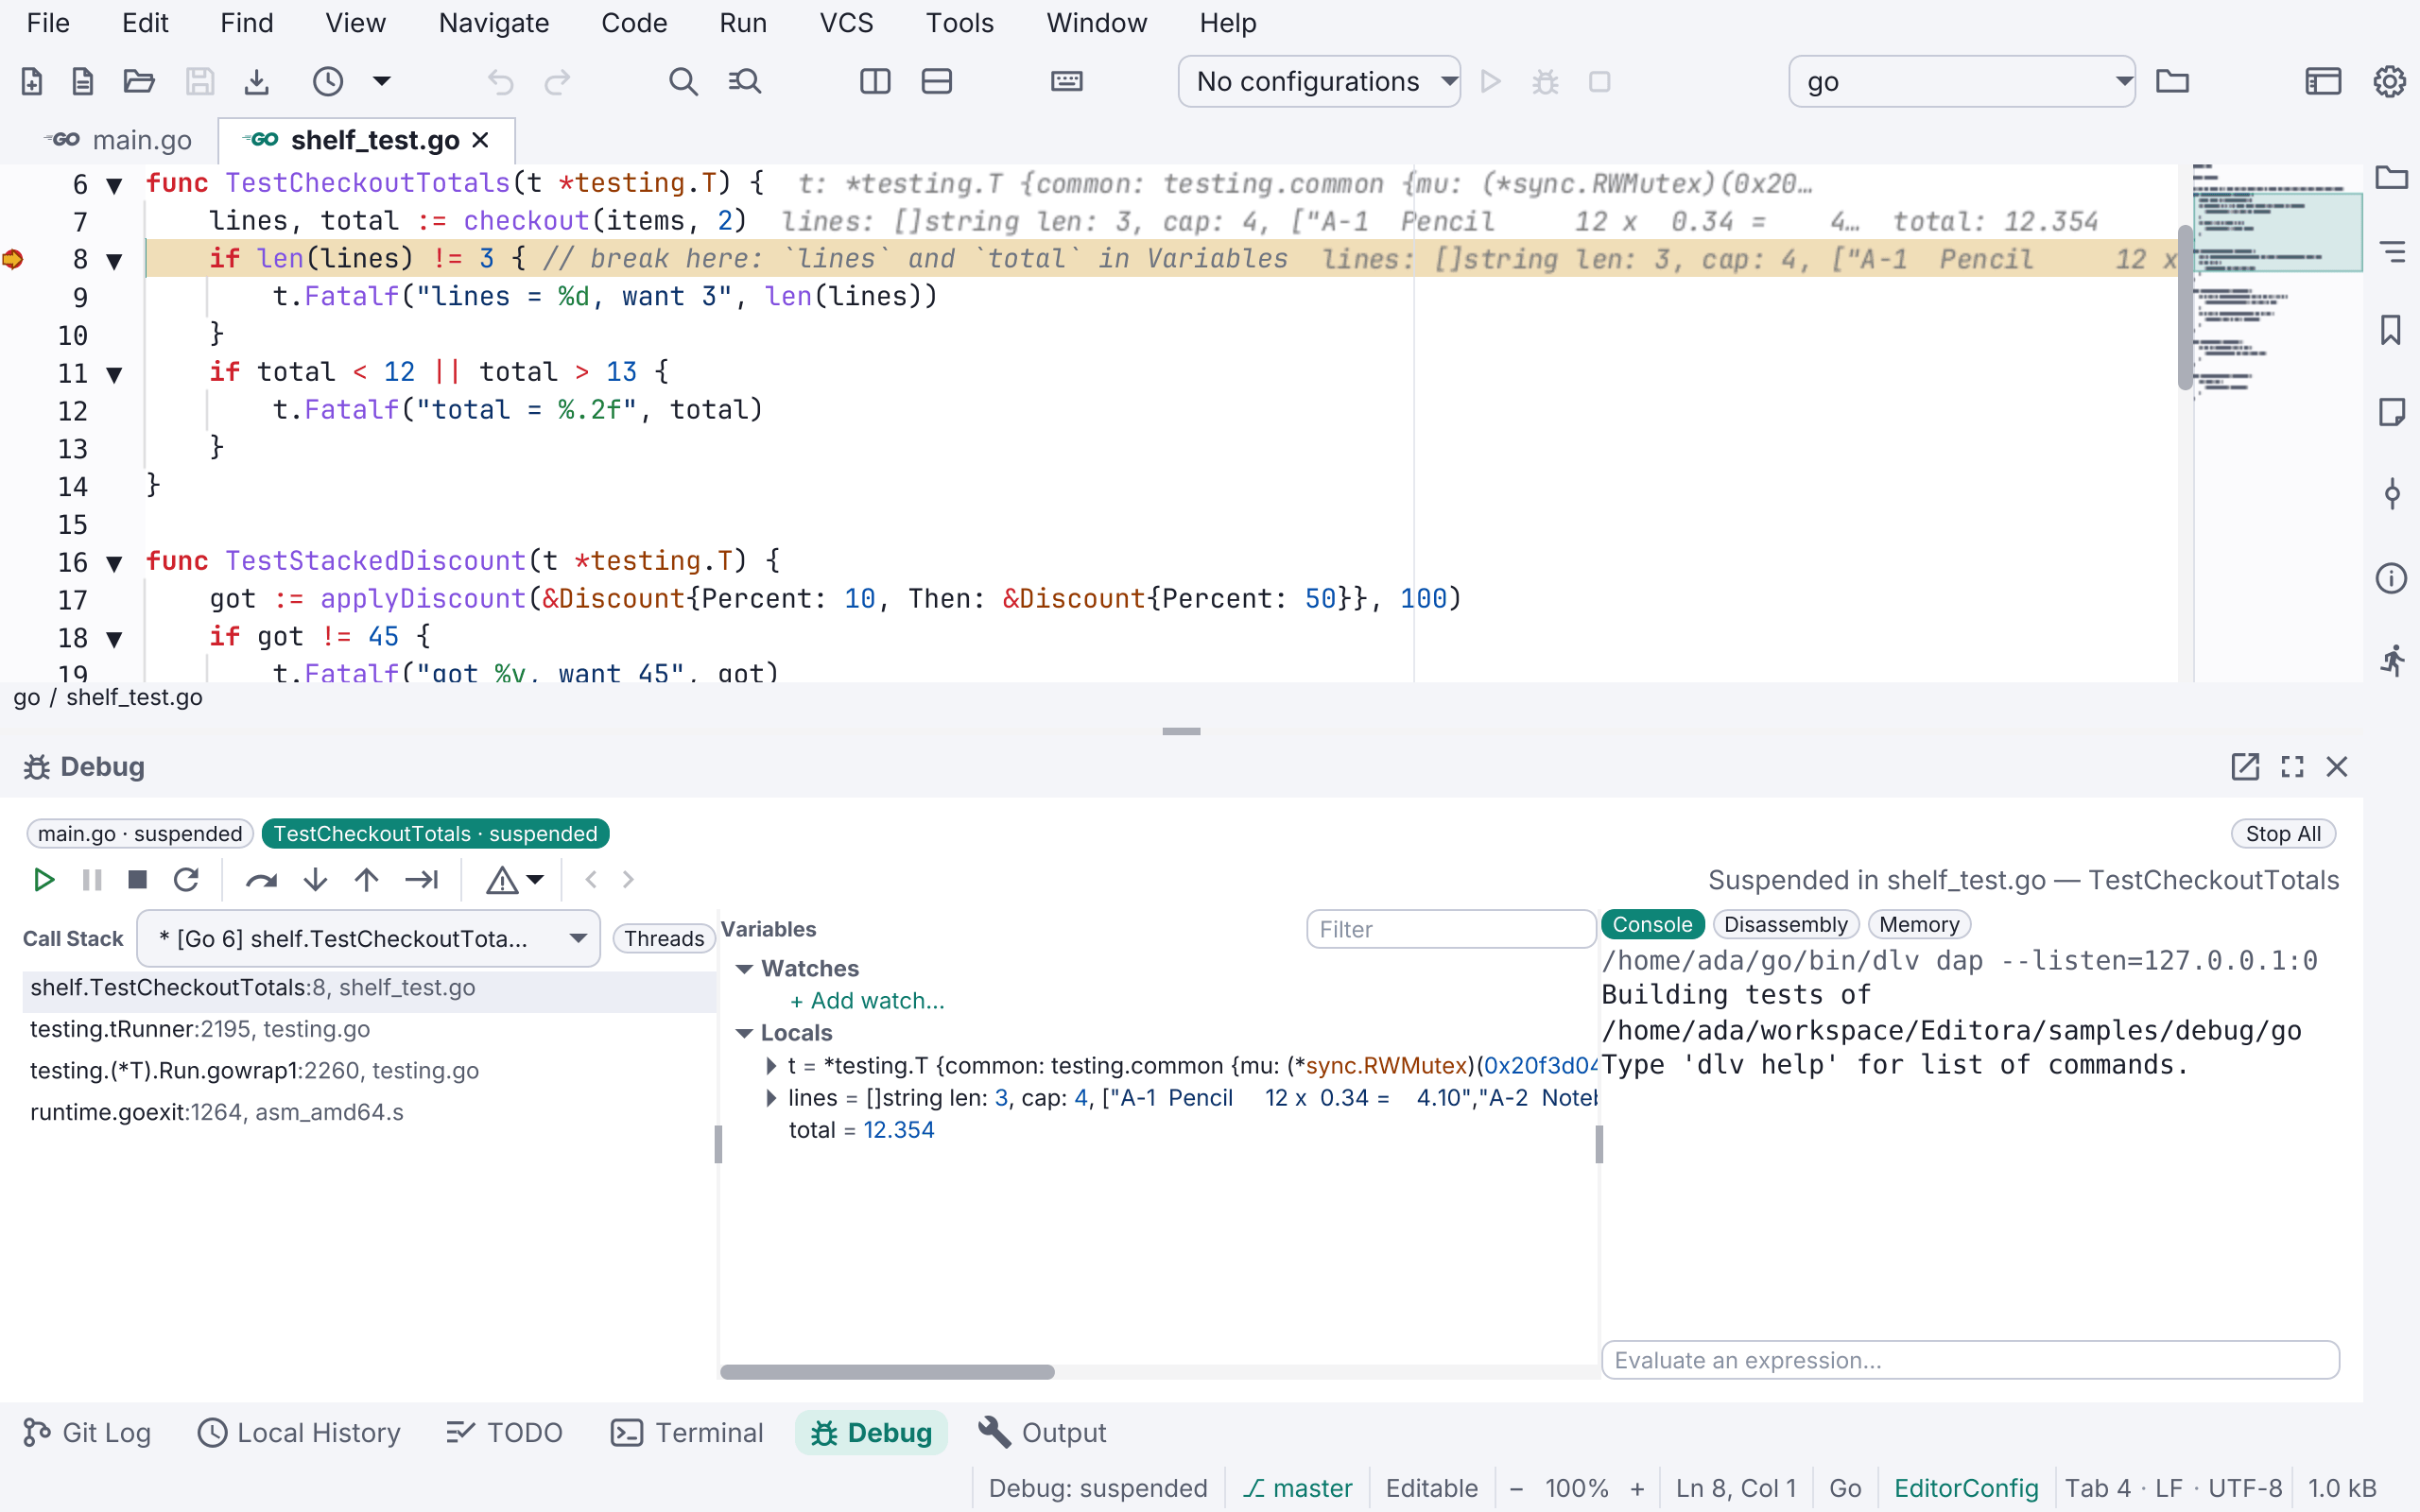
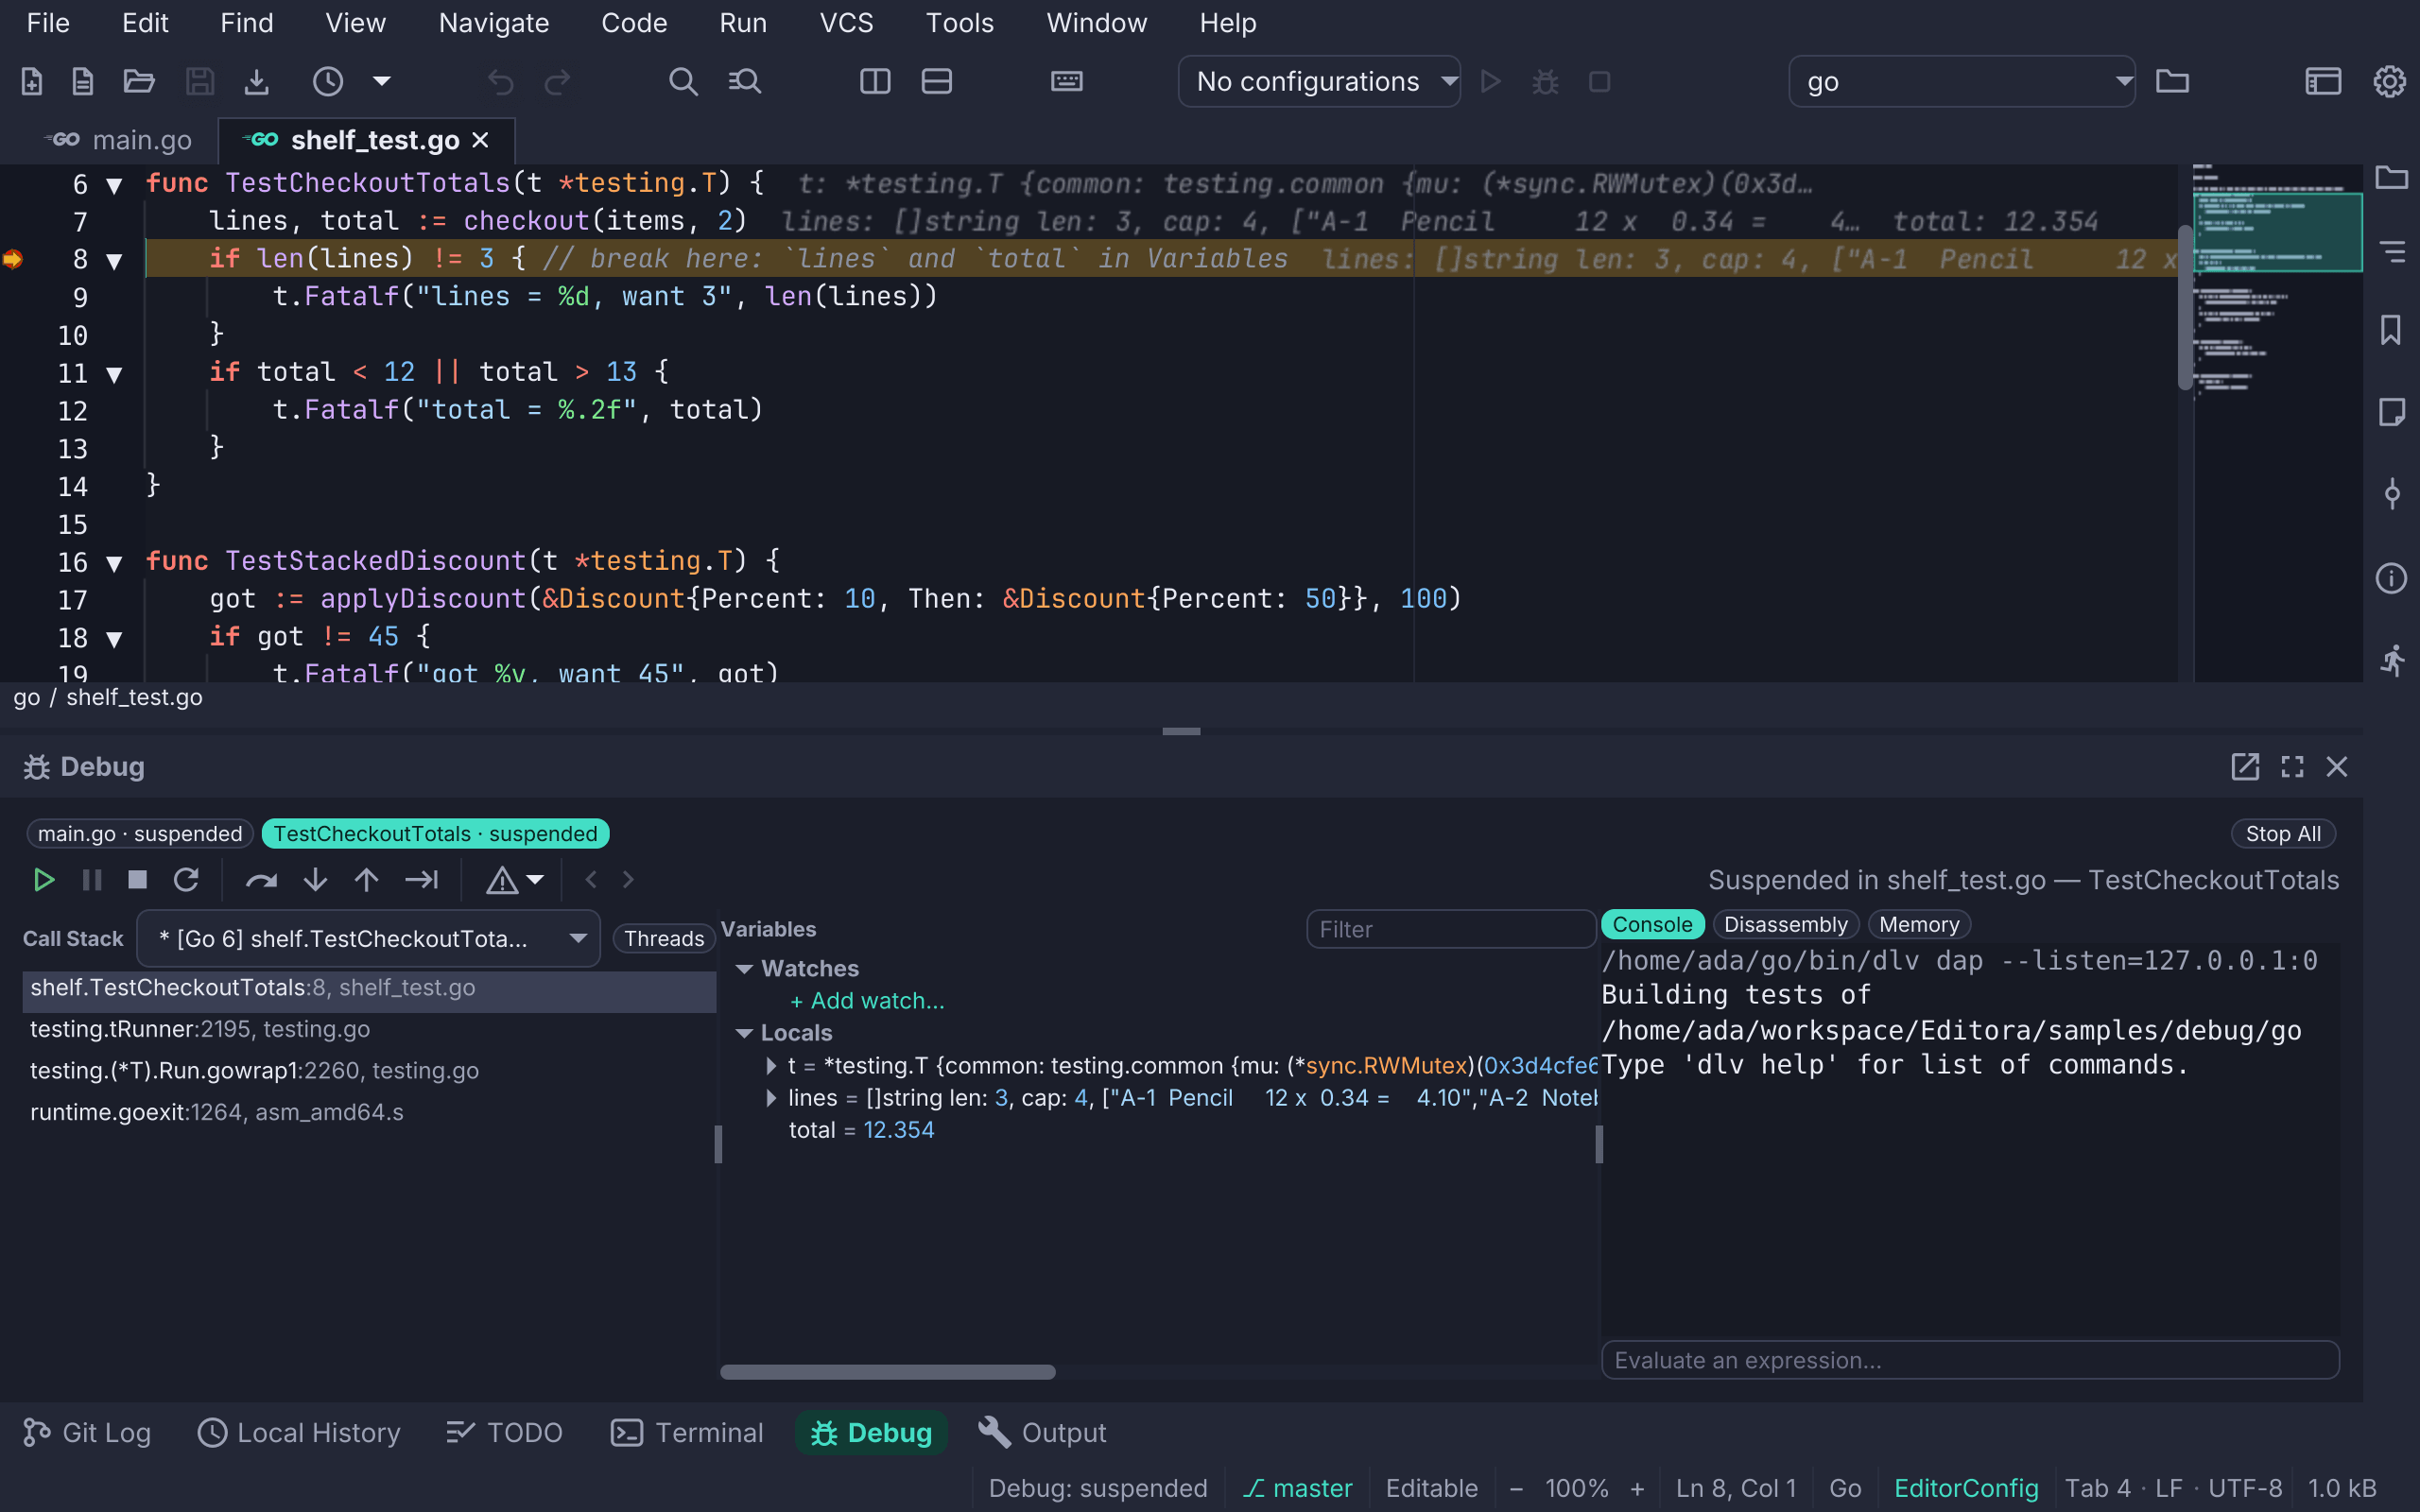
Stop stops the session shown. Stop All, at the right of the tabs while
two or more sessions run, ends them all; it is also in the Run menu and in
the palette as Debug: Stop All Sessions (debug.stopAll). A session that
ends keeps its tab and its output, marked ended, until you close the tab with
its ×, or with Debug: Close Ended Session (debug.closeEndedSession) while
it is shown. Debug: Switch Debug Session… (debug.switchSession) picks the
session to show from the keyboard. A window keeps up to eight sessions: past
that, a new one takes the place of the oldest ended one.
A launch.json configuration started while a session runs is debugged beside it, as in VS Code, without asking. A compound starts several programs together, and a Python program’s subprocesses get sessions of their own.
Exception breakpoints
Debug: Exception Breakpoints… (debug.toggleExceptionBreakpoints) lists
the exception filters of the debugger for the current session’s language (or
the active file’s, when no session runs). A checkmark marks the ones that are
on; choosing one turns it on or off, also during a session.
| Language | Filters | On at the start |
|---|---|---|
| Python | Raised Exceptions, Uncaught Exceptions, User Uncaught Exceptions | Uncaught Exceptions |
| Java | Caught Exceptions, Uncaught Exceptions | none |
| JavaScript | Caught Exceptions, Uncaught Exceptions | none |
| Groovy, Kotlin, Clojure, Scala | Caught Exceptions, Uncaught Exceptions | Uncaught Exceptions |
| Rust | Rust: on panic | Rust: on panic |
| C and C++ (CodeLLDB) | C++: on throw, C++: on catch | C++: on throw |
| C# | C#: user-unhandled exceptions, C#: all exceptions | C#: user-unhandled exceptions |
| Ruby | Ruby: any raised exception, Ruby: RuntimeError | none |
| PHP | PHP: exceptions, errors, warnings, notices, deprecations, everything | none |
Go has none to choose: Delve stops on a panic by itself.
A session starts with the filters its debugger turns on by default, so a
Python program stops where an uncaught exception is raised, with the
exception’s type and message in the Debug window and the status bar. In
Python, sys.exit() with a non-zero code also counts as an uncaught exception;
Continue then ends the program. Editora keeps your choice for each language and
each project, as it does for Break on Caught Exceptions and Break on
Uncaught Exceptions (see Managing breakpoints).
Exception breakpoints by type
To stop only on some exceptions, name their type, as IntelliJ IDEA’s exception
breakpoints do. Debug: Add Exception Breakpoint…
(debug.addExceptionBreakpoint, also in Run ▸ Breakpoints) opens a form
with:
- Exception type: a type, or patterns separated by commas.
*and?are wildcards and!before a pattern leaves it out, sojava.io.*,*Errorand!InterruptedExceptionall work. A pattern matches the full type or its last part, soKeyErrormatches Python’sKeyError. Blank is any type. - Language: the language whose exceptions it is for.
- Condition (optional): an expression evaluated where the exception was
thrown.
KeyErrorwithorder.id == 42stops on that one order’s error and lets the rest go by. - Enabled.
When the program is stopped on an exception, the form offers that exception’s
type. Subclasses are not matched by themselves: name them, or use a pattern
such as *IOException.
The program then stops only on an exception that matches; the others go by. An exception nothing catches always stops, and while Break on Caught Exceptions is on, every exception stops as before. If the condition can’t be evaluated, the program stops and the status bar says why.
Exception breakpoints are listed in Debug: Exception Breakpoints…, after the debugger’s own filters. Choose one to edit it, turn it off or remove it. They are kept per project, with the other breakpoints, and work with every language whose debugger stops on exceptions.
Exception card
When the program stops on an exception, a card opens under the line that threw it, once per stop. Its title says what kind of stop it is:
- Uncaught exception, in red, for an exception that nothing catches;
- Exception (caught) for one the program catches;
- Exception when the debugger doesn’t say which. The Java debugger says which.
Below the title are the exception’s type and its message. When the debugger sends them, the card also lists the exceptions that caused it, each on a Caused by line, and the stack trace. The Python and JavaScript debuggers send them; the Java debugger sends only the type and the message.
- Copy copies the type, the message, the causes and the stack trace; so
does Debug: Copy Exception (
debug.copyException). - Don’t Stop on Caught Exceptions appears on a caught exception while Break on Caught Exceptions is on, and turns that off, so the program no longer stops on exceptions it catches.
The card never takes focus, so typing stays in the editor. Esc in the editor, the card’s ✕ or a click anywhere else closes it, and so do Continue, a step, picking another frame in the call stack, or the session ending. It follows its line when you scroll, and closes when the line leaves the screen.
Debug: Show Exception (debug.showException, in Run ▸ Debugger while
the program is paused) opens the card again. If another frame is shown, it goes
back to the frame that threw first. When the program did not stop on an
exception, the status bar says so.
Attach to Process
Debug: Attach to Process… (debug.attachToProcess, in Run ▸ Launch and
Attach) lists the Java, Node.js, Python, Go, Rust, C and C++ programs
running on this machine under your user, so you can attach to one without typing its address.
It is also the last row, A program on this machine…, of the
Attach list a Java file shows once the project has
attached before. Type to filter the list. Programs listening for a
debugger come first:
- a JVM started with the JDWP agent as a server on a fixed port, such as
-agentlib:jdwp=transport=dt_socket,server=y,suspend=n,address=5005(or-Xrunjdwp:…). A JVM started withserver=noraddress=0can’t be attached to; - a Node.js started with
--inspect,--inspect-brkor--inspect-wait(port 9229 unless it names another); - a Python program started under debugpy with
python -m debugpy --listen 5678 app.py; - any Go program, on Linux and macOS. Delve attaches to it by its process id, so it needs no flag; Editora tells a Go program by reading its executable;
- a Rust, C or C++ program built with debug information, on Linux. CodeLLDB attaches to it by its process id. Editora tells a Rust program from a C or C++ one, listed as Native (C, C++), by reading its executable. A program built without debug information isn’t listed.
Each row names the main class, jar, script or program and the process id, and below them the kind of program and where it listens, such as Java · listening on localhost:5005, Go · Delve attaches by process id or Native (C, C++) · CodeLLDB attaches by process id. A program of these kinds that was started without debugging is listed too, with what to start it with instead: not started for debugging (start it with —inspect). Picking such a row says the same in the status bar and attaches nothing. With none of these programs running, the list says so.
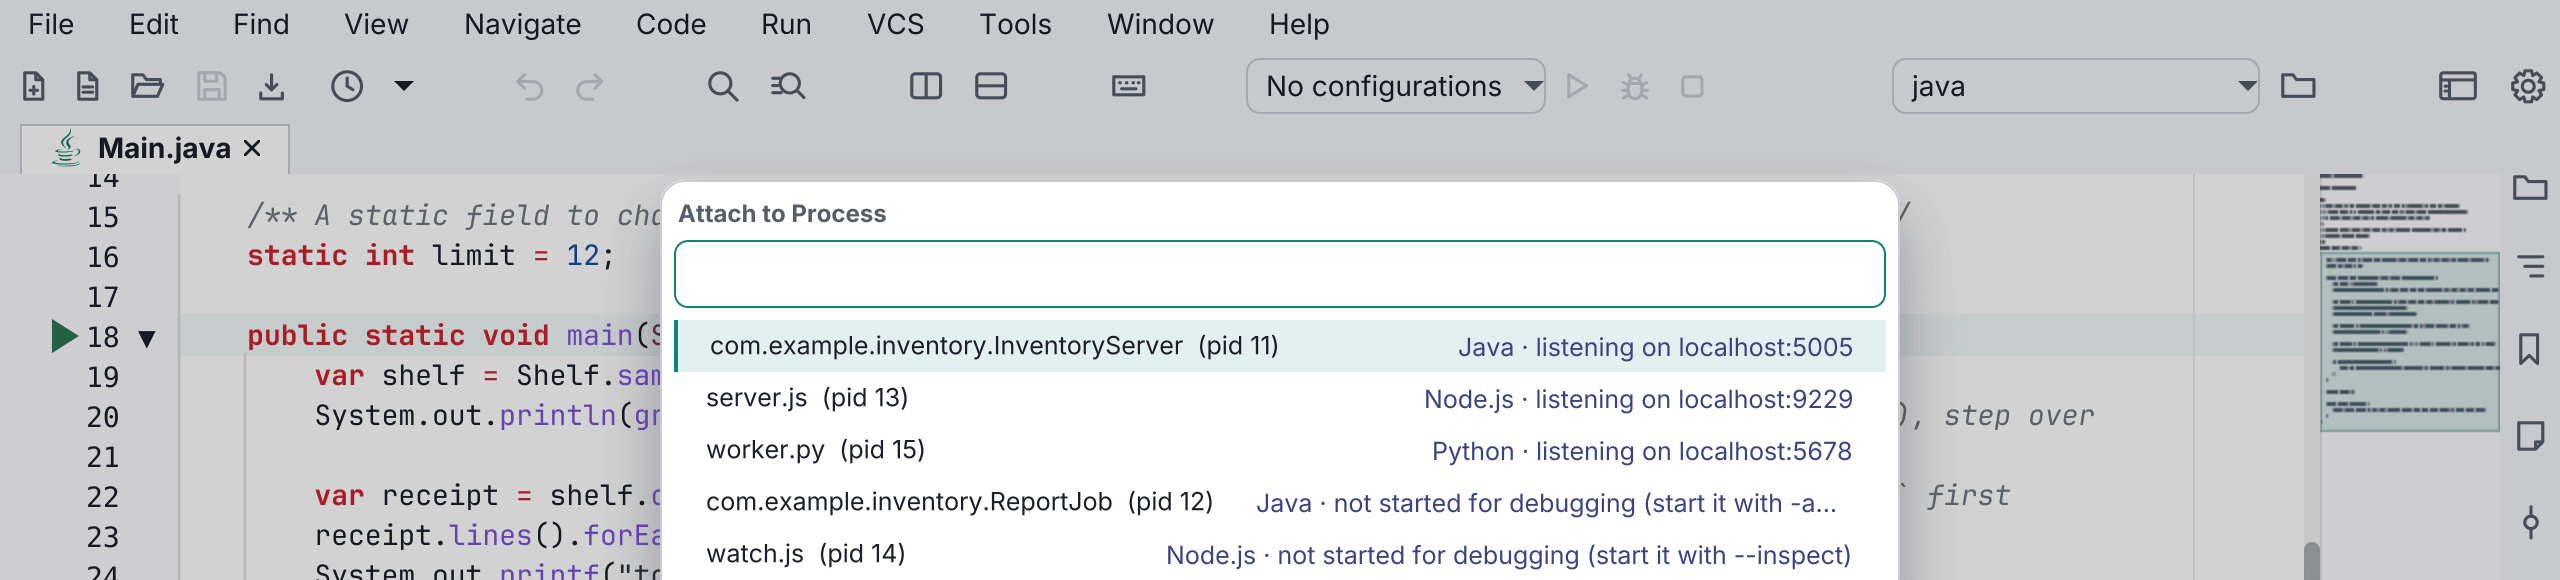
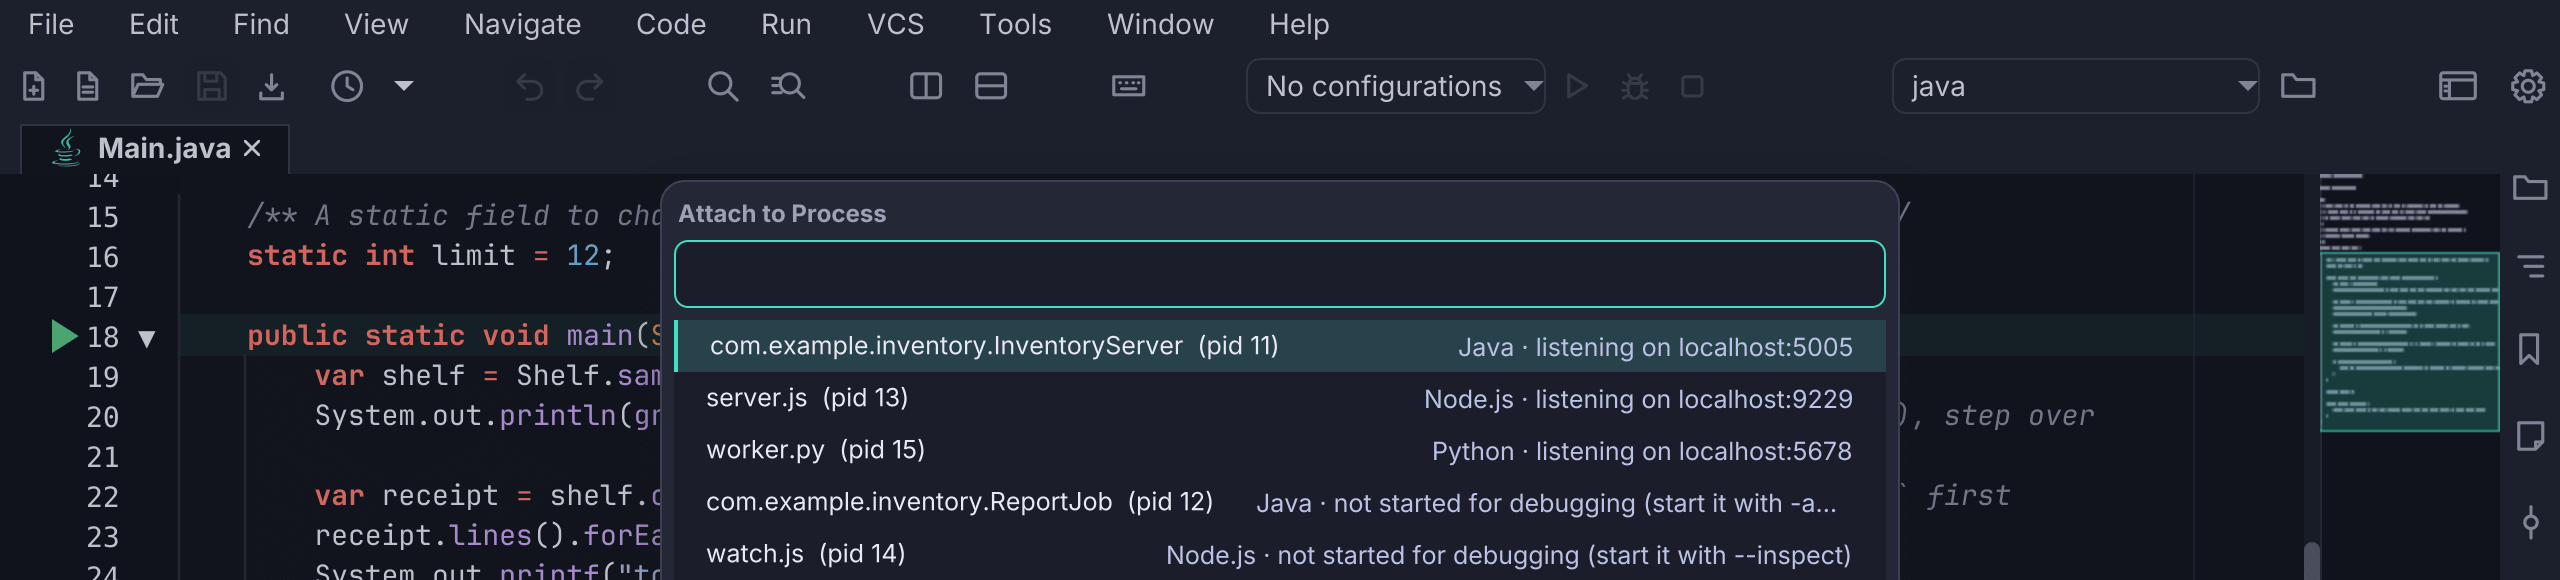
Picking a listening program attaches the right debugger to it and opens the Debug window. Stop detaches: the program keeps running, and you can attach again.
- Java attaches the way Attach to Running Program does, through a Java file of the program’s project: the active tab if it is one, else the first open Java tab. With no Java file open, the status bar asks you to open one, since the debugger finds the program’s classes through it. The address is added to the project’s Attach list, so Debug: Reattach goes back to it.
- Node.js attaches through vscode-js-debug, as Attach to a running program does.
- Python connects to debugpy inside the program, so Editora doesn’t need
a debugpy of its own. A program listening only on another network address of
this machine, not on
localhost, can’t be attached to yet. - Go attaches Delve to the process, with the breakpoints
of the project’s Go files. On Linux, a debugger may attach to a program it
didn’t start only when
kernel.yama.ptrace_scopeis 0, which many distributions don’t make the default;sudo sysctl kernel.yama.ptrace_scope=0sets it until the next restart. Not on Windows. - Rust, C and C++ attach CodeLLDB to the process by
its process id. The same
ptrace_scopesetting applies. A macOS program keeps its debug information outside the executable, so it isn’t listed there.
Opening a core dump
Debug: Open Core Dump… (debug.openCoreDump, also in Run ▸ Launch and
Attach) opens the core file a crashed Go, C, C++ or Rust
program left behind, or one made with gcore, as GoLand and CLion do. Pick
the core file; on Linux the program it is the memory of is named inside the
core, so Editora finds it. Otherwise, or when the program has moved since,
Editora asks for the program too. A Go core opens in Delve,
the others in CodeLLDB.
The session opens stopped where the program crashed, with the signal on the Debug window’s state line, such as Core dump: SIGSEGV…. The stop shows the first frame in the program’s own code, not the runtime’s or the C library’s frame that raised the signal, so the line drawn as the crash is your line. Every thread is there with its call stack and variables, and evaluating, watches, the Threads view and Thread Dump work as at any stop.
A core is the memory of a program that has ended, so it can’t run: Continue,
the steps, Run to Cursor, Jump to Line, Restart Frame and Resume Thread are
disabled, and their tooltips and the command palette say why. A
launch.json configuration that opens a core, such
as Delve’s "mode": "core", is treated the same way.
Debugging Python
Debug a Python file with Debug: Start / Continue (debug.start), or with
Debug File in the editor’s right-click menu, next to Run File. The
program runs the way Run runs it: under the same
interpreter (the project’s virtual environment, the one picked for the project,
or the shebang’s), in the script’s own folder, with the project root and its
src/ folder at the front of PYTHONPATH, and with the arguments set by
File: Run with Arguments… (file.runWithArgs). The Debug console’s first
line shows the command that runs. When the program ends, the console shows its
exit code.
A script whose shebang hands it to a runner (uv run --script, pipx run,
poetry run python, pdm run python) is debugged under the project’s Python:
the debugger needs an interpreter, not a runner.
The debugger itself (debugpy) runs under the same interpreter when that interpreter can import debugpy, else under the Python interpreter set on the Python card of Settings → LSP.
A process the program starts, with multiprocessing or as a Python
subprocess, is debugged too, in a session of its own beside the program’s (see
Several sessions). Its tab is named as debugpy names it,
such as Subprocess 1234. Its breakpoints stop, and the Debug window shows it
when it stops. Stopping the program stops its subprocesses, and a subprocess’s
tab goes once it ends, unless it is the one shown. Restart isn’t available in a
subprocess’s session: restart the program that started it. To run
subprocesses without the debugger, turn off Debug Python subprocesses on
the Python card of Settings → Debugging. A program debugged on a
remote host runs its subprocesses without the
debugger.
A breakpoint on a line of a Django or Jinja template stops on that line.
The call stack’s top frame is the template, and Variables shows the template’s
context, such as a loop’s item and forloop. Editora turns this on for a
project that uses Django (a manage.py, or Django in its requirements) or
Jinja (Jinja2, Flask or Quart in its requirements). Template breakpoints
on the Python card of Settings → Debugging sets it for every project:
Automatic (the default), Django and Jinja, or Off. A project in a
remote folder isn’t detected, so pick Django and Jinja there.
A pandas DataFrame or Series, or a numpy array, opens as a table of its rows with View as DataFrame or View as Array.
A pytest test is debugged from its test file:
- Debug Test at Caret (
test.debugAtCaret) debugs the test at the caret (the whole file outside any test). - The editor’s right-click menu on a test has Debug This Test (or Debug This Class).
- In Test Results, a Python test’s right-click menu has Debug This Test (a class row: Debug This Class).
The test runs as python -m pytest with its node id, from the project root (the
file’s folder when there is no project), under the debugger. When the
interpreter has no pytest, a unittest.TestCase test runs under
python -m unittest instead; for any other test the status bar names the
interpreter that lacks pytest. A Python
run configuration runs but cannot be debugged; debug its
file instead.
Program input in the Debug console
A debugged Java, Python, JavaScript or Rust program can read its
standard input from the Debug console, so a Python program that calls input() waits
for a line typed there.
The field does one of two things, and its prompt says which:
- While the program runs, Enter sends the line to the program (an empty line counts).
- While it is paused, Enter evaluates an expression.
The field takes your keymap’s editing keys, as the evaluate fields do.
End the input with Ctrl+D in the field, the console’s right-click menu, or
Debug: End Program Input (EOF) (debug.endProgramInput).
In this mode Editora starts the program itself rather than leaving it to the debugger, and stops it on Stop, Restart, a new launch, a failed launch, or closing the window. The session ends when the program exits, after its last output, and the console reports the exit code. A Python program’s output is unbuffered, so a prompt shows before the program waits. Lines written to stdout and stderr at almost the same moment can appear in either order.
It is on by default. The switch, Run the debugged program in the Debug
console (program input), is on the Debugged programs card of
Settings → Debugging (or use
Debug: Toggle Program Input in the Debug Console,
debug.toggleProgramConsole) and takes effect at the next launch. It applies
to a launched Java or Rust program, and to a Python or JavaScript program
started on this computer; a Python or JavaScript file on a remote host, in WSL or in a
container is unaffected, and so are attached sessions.
Run the program in a Terminal tab instead, just below it, runs that program
in a tab of the Terminal
tool window rather than the Debug console. Use it for a program that draws on
the screen, reads single keys or asks for a password. Its output and input are
then in that tab, which is titled Debug:
With the switch off, the debugger starts a Java program itself. A program that
prints a lot then gets its output to the console well after it writes it; the
session ends, and the exit line shows, once the last of it has arrived. Until
then the Debug window’s state reads Program ended, output still arriving. The
console still reports the program’s exit code on Linux and macOS when the
program runs on this machine. On Windows, and on a remote host, in WSL or in a container, it
says “The program ended.” instead. A JavaScript program’s output, including
process.stdout.write, still reaches the console, but the program cannot read
input.
Debugging Java
Compact .java sources and extensionless Java --source 25+ shebang files can
be debugged with breakpoints, stepping, and local variables. Editora maps
breakpoints and stack frames to the original file and removes its temporary
compiled files after the session. Java debugging needs the Java language server
and debug adapter described below. In a folder you have not
trusted, the Java language server runs
without the project’s Maven or Gradle build, so trust the folder before
debugging a project’s code.
JUnit tests are debugged from their gutter icon, with Debug Test at Caret, or
with Debug in the test file (see Starting a Java session),
including tests inside @Nested classes; see the
test runner.
Starting a Java session
Debug on a Java file debugs that file’s own main. When the file has no
main and its folder has a single main class, Debug runs that class, and the
Debug console says which program runs. The gutter’s Debug ▶ and Debug on a file
use the saved run configuration that names the same
class, so its arguments, VM options, environment, working directory and JDK
apply, as they do for Run ▶. Before a Java launch, Editora saves every unsaved
Java file of the project.
In a JUnit test file of a Maven or Gradle project, Debug debugs the test at the
caret, or the whole class when the caret is outside a test, the way Debug Test
does. The caret on a test’s annotations, such as @Test, counts as in that
test. A file with a main of its own is launched as a program instead.
In a Maven or Gradle project, Debug builds first, so the program runs the code you see. Debug on a file builds the project with the Java language server: if that build finds compile errors, nothing is launched, the Debug console lists the errors as links to their lines (with paths relative to the project), the status bar gives their number, and the Debug window reads “Not started: the build failed”. If the project could not be imported, the console says so instead; when its errors name a Java version, choose another Default JDK in Settings → Build Tools. If the build cannot run, the program starts anyway, and the console warns you when a class file is missing or older than its source.
Debug Main Class and Debug on a saved configuration compile with the build
tool when Build before Run and Debug is on (the default): Maven compile,
or test-compile for a class under src/test; Gradle compileJava or
compileTestJava. The build runs in the Debug console, through the same Maven
or Gradle the tasks tree runs, and a failed build aborts the launch. With the
setting off, they build with the Java language server, as Debug on a file does.
In a Gradle project the Java language server builds after Gradle as well, since
the program runs from the class files it writes, so the program runs the code
you edited. The Gradle daemon that this build starts stops after 10 minutes
without work. Stop during either build cancels the launch. A run configuration
with a before-launch step uses that step as its
build instead. A Java configuration’s step runs in the project root, whatever the
configuration’s working directory.
A class with a package line in a folder that has no pom.xml or Gradle build
can be debugged too, and such a class has Debug File in the editor’s
right-click menu. In a project window for such a folder, Debug Main Class and
Debug on a saved Java configuration work, and the program runs in the project
root.
A loose .java file, or a project folder without Maven or Gradle, is built by
the Java language server before every Debug, so the program always runs the
code you saved. When that build reports errors or cannot run (a folder with
several packages can be more than the language server works out without a
build tool), Editora compiles the file with javac from the source root its
package line names. javac compiles only the code the program uses, so only
errors there stop the launch, listed in the Debug console as in a Maven
project; a broken file the program never uses, or a JUnit test without JUnit,
does not. Code that does not compile never runs. A configuration’s
before-launch step runs first, and the build after it. The program runs on the
Default JDK, else on the java on your PATH (see
Which runtime a program runs under).
When the Default JDK’s folder no longer exists, the Debug console says so and
the java on your PATH runs the program. A compact source file is always
compiled by javac.
While the language server builds before a launch, the Debug window reads Building… from the moment you press Debug, and Stop cancels the launch.
Start / Continue (and the Debug window’s green ▶), Debug File in the editor’s right-click menu and Debug Test make one check before they launch. Start / Continue on a paused session continues it. For another file, a session that is paused, running or still starting (building, compiling, waiting for a test to start, or waiting for you to choose a main class) is replaced only after you agree, for example to Main.java is paused in the debugger. Stop it and debug App.java instead? For the same file, the status bar says that it is already being debugged and whether it is running, paused or still starting. Esc on the main-class chooser cancels the launch.
Debug: Attach to Running Program… (debug.attach) on a Java file attaches
to a JVM listening for a debugger. The first time in a project, it asks for the
host:port, offering localhost:5005. After that it lists the addresses this
project attached to, at most eight and the most recent first, then Another
address…, which asks for one, offering the most recent, and last
A program on this machine…, which opens
Attach to Process. The list is kept
with the project, so it is there after a restart. When nothing listens at the
address, the Debug console shows the -agentlib:jdwp option that starts a JVM
listening on it.
Debug: Reattach (debug.reattach, C-c C-d S-a) attaches again to the
address this project attached to last, without asking. Before the first attach,
the status bar says to use Attach to Running Program. Reattach is in
Run ▸ Launch and Attach.
When Java debugging can’t start, the status bar names the missing piece: LSP is off, the Java language server is turned off, or jdtls or java-debug was not found. The Java card of Settings → Debugging has an Install… button for what is missing.
Stepping through Java code
Step Into skips JDK classes (java.*, javax.*, jdk.*, sun.*, com.sun.*
and a few more) and synthetic methods, and a frame’s variables include its
class’s static fields. You can turn either off on the Java card of
Settings → Debugging: Step Into skips JDK classes and synthetic methods
and Show static fields in Variables. To have Step Into go over your own or
a library’s classes too, add them to Don’t step into.
When you step into JDK or library code anyway, or click such a frame in the call stack, its source opens in a read-only tab. A stop at a breakpoint, a Pause or an exception still selects the nearest frame of your own code.
Debug: Smart Step Into… (C-c C-d s, also in Run ▸ Stepping) lists the
calls on the current line in the order they run, for example twice(1),
twice(2) and add(twice(1), twice(2)). Pick one to step into it. On a line
with a single call it steps straight in. The list closes when the program runs
on.
Debug: Restart Frame (C-c C-d f, the call stack’s right-click menu, or
Run ▸ Stepping) runs the method of the selected frame again from its first line
and pauses there. It is greyed out on the bottom frame.
If the connection to the debugger is lost, Editora ends the program at once and says so in the Debug console and the status bar.
Threads in a Java program
Pause stops the whole Java program: every thread is suspended, not only the one on screen. Continue after a Pause resumes every thread. A step between the two runs only the thread you step, and the next Continue still resumes them all.
By default, a breakpoint, an exception or a step stops only the thread that hit it, and the program’s other threads keep running. To stop them all, turn on Suspend all threads when one stops on the Java card of Settings → Debugging (off by default). Continue then resumes every thread. The setting takes effect at the next debug session.
To pause or resume one thread and leave the others as they are, use the Threads view.
Editing during a session
The running program keeps the code it was started with. When you edit a file
during a session, Editora matches breakpoints and the stopped line to the code
the program runs, so they stay on the right lines. At a stop in an edited file,
the status bar says that the program still runs the code it started with. A
breakpoint on a line you change in place, re-indent or wrap in a block (such as
an if) keeps working and stopping there; when you split a line in two, the
breakpoint stays on its first half. A breakpoint on a line you added during
the session is kept, and its hover says that it takes effect in the next
session. To run the new code, restart the session, or let
hot code replace load a change to a method body.
Hot code replace
During a Java session, saving a .java file loads the change into the running
program without restarting it. Editora builds the project with the Java
language server and sends the changed classes to the program. The Debug
console and the status bar say which classes were replaced, or why nothing
was:
- the project has compile errors: fix them and save again;
- the program refused the change, with its reason. A change to a method’s body can be loaded; a change such as adding or removing a method or a field needs a restart, and the console tells you so;
- for a file without Maven or Gradle, the program runs an older Java than the code was built for (“the program runs Java N, but the code was built for Java M”): choose the program’s JDK as the Default JDK in Settings → Build Tools, or restart the session;
- the Java language server could not build the project;
- the session runs classes compiled with
javac, because the Java language server cannot build the folder: restart the session to run your edits; - the program already runs this code.
A change to a method that is running when you save is applied too. That method
goes on with its old code until it returns, and its frame in the call stack
reads “old code (replaced while it ran)”. To run it again with the new code,
select its frame and use Debug: Restart Frame. The first method of a
thread, such as main, has no caller to run it again, so it keeps its old code
until the program restarts, and the console says so.
Choose when this happens with Apply code changes to a running Java program on the Java card of Settings → Debugging:
| Choice | What a save does |
|---|---|
| On save (default) | loads the change when you save a file yourself; autosave does not |
| Only with Debug: Apply Code Changes | shows a hint in the status bar; run Debug: Apply Code Changes (C-c C-d h, Run ▸ Debugger) to load the saved changes |
| Never | nothing; Debug: Apply Code Changes says that it is off |
Debug: Apply Code Changes loads only what is saved. When the active Java tab has unsaved edits, the console says so.
Hot code replace also runs in an attached session and in Debug Test and Debug via Build Tool sessions. There the program runs the classes your build tool compiled, so a change can be refused that a session Editora started would accept; the console then tells you to restart.
Debugging JavaScript and TypeScript
Debug on a JavaScript or TypeScript file (.js, .mjs, .cjs, .ts,
.mts, .cts, or a node shebang script) runs it under vscode-js-debug,
started exactly as Run starts it: the same Node.js, flags, environment and
folder, and for TypeScript the project’s tsx or the compiled file (see
Node.js scripts). That Node.js is chosen as described in
Which Node.js runs: a configuration’s own, then a project’s
.nvmrc or .node-version, then the Node.js card under Settings → Build
Tools, then node on your PATH. The Debug console’s first line is the command that runs. When that
is a compiled file older than its source, a red line says so: build the project
first to debug your latest changes. The JavaScript card under Settings →
Debugging has a link to the Node.js card, and its Detected line names the
vscode-js-debug version and the Node.js it runs on, such as found (1.117.0 ·
Node.js v24.18.1).
- TypeScript files without tsx or a compiled file are debugged on plain
Node.js 22.18 or newer. With an older Node.js, Debug says so. In a project
that compiles its TypeScript, a breakpoint in a
.tssource stops there when the compiled JavaScript runs, through its source maps. - JSX and TSX files can’t be run by Node.js. Debug the compiled JavaScript
instead; a breakpoint in the
.jsxor.tsxfile still stops there through its source map. - Output and input. All output reaches the Debug console in the order the
program wrote it, with its colours, including
process.stdout.writeandreadlineprompts. Output to stderr is not shown in red, because it shares stdout’s stream to keep that order. The program can read lines you type there (see Program input in the Debug console). - Node.js’s own modules are skipped, so Step Into doesn’t enter them. In the call stack, Node.js’s own frames fold into one row, such as … 7 frames of runtime or library code (click to show); click it to see them.
- Code run through
evalopens read-only where it stops, and takes breakpoints for the session (see Code without a file). Debug: Loaded Sources… lists the program’s scripts (Loaded Sources and Modules). - Lambda breakpoints stop inside arrow functions and function expressions each time they run.
- Every breakpoint is placed before the program starts to run, so one on the program’s first lines, or in a function it calls right away, stops on the first run too.
- A breakpoint condition that isn’t valid JavaScript marks the breakpoint as rejected, and the console says why, once.
- Child processes and worker threads show all their threads. The status line names the file a thread stopped in, such as Suspended in worker.js — parent.js.
- Debug Test at Caret (
test.debugAtCaret) on anode:testtest runs that test undernode --testand stops at its breakpoints. - Node.js script and npm script run configurations can be debugged, started the way Run starts them.
Attach to a running program. Start Node.js with --inspect (for example
node --inspect server.js), then run Debug: Attach to Running Program…
(debug.attach) on a JavaScript or TypeScript file. It asks for the
inspector’s host:port, such as localhost:9229. Once attached, the console
names the address, such as Attached to 127.0.0.1:9229. A program started with --inspect-brk waits
before its first line; attaching does not start it, so press Continue. The
list of earlier addresses is for a JVM only: on a JavaScript or TypeScript
file, Attach and Debug: Reattach both ask for the inspector’s address.
Attach to Process lists the Node.js programs started with
--inspect instead, so you don’t need the address.
vscode-js-debug itself needs Node.js 18 or newer to run. An older Node.js
chosen for a project still runs the program, while vscode-js-debug runs on the
newest Node.js 18 or newer that nvm has, else node on your PATH. When
vscode-js-debug can’t start, or no Node.js new enough is found, Debug says so
instead of stopping without a word. Install… on the JavaScript card
installs only vscode-js-debug v1.117.0, a version tested with Editora.
Debugging in a browser
Debug: Debug in Browser… (debug.browser, in Run ▸ Launch and Attach)
opens a web page in Chrome, Edge or another Chromium browser (Chromium, Brave,
Vivaldi) under vscode-js-debug, as VS Code does. Breakpoints in the page’s
scripts stop it, with its variables, call stack, console output, stepping and
evaluation as for a Node.js program, and through source maps a breakpoint in
your TypeScript or framework source stops too. The list offers the HTML file in
the editor (This page: …), the pages you debugged before, and Another
page…, which asks for a URL, such as your dev server’s localhost:5173.
Debug: Start / Continue (F5) on an HTML file serves its folder the way the live preview does and opens the page in the browser. An HTML file takes breakpoints in its inline scripts.
Debug: Attach to Browser… (debug.attachBrowser, also in Run ▸ Launch
and Attach), or Debug: Attach to Running Program… on an HTML file,
attaches to a Chrome or Edge started with --remote-debugging-port=9222; it
asks for the port. A launch.json chrome or
msedge configuration launches or attaches as it does in VS Code.
The browser runs with a profile of Editora’s own, kept between sessions, so a page you signed in to stays signed in and your everyday profile is left alone. Stop closes the browser. Debug web pages in, on the JavaScript card of Settings → Debugging, chooses the browser; Automatic takes the HTML preview’s browser when it can be debugged, else the first of Chrome, Edge, Chromium, Brave and Vivaldi that is installed. When the chosen browser isn’t found, another one is used and the status bar says so. Firefox and Safari can’t be debugged this way.
The browser has 30 seconds to start; a launch.json configuration’s own
timeout sets another limit. When the debugger gives up on the browser, or the
browser exits while starting, the status bar says so and the Debug console
shows the debugger’s own error.
Managing breakpoints
A breakpoint’s glyph shows its kind by shape as well as colour: a dot for a
plain breakpoint, a diamond for a logpoint, two ”=” bars for a breakpoint with
a condition or a hit count, a “1” for a
temporary breakpoint, a λ for a
lambda breakpoint, purple with a ring for a
recording breakpoint, an hourglass for a
triggered breakpoint, and grey for a disabled one. Java
method breakpoints and field watchpoints
have marks of their own on their member’s line.
Its hover names the condition, log message, hit count and group, and says when it is
disabled, removed once hit, recorded in Debug History, or waiting for another
breakpoint. A hit
count stops on that hit in Java too: 3 stops the third time the line runs.
Right-click a glyph for Edit Breakpoint…, Enable Breakpoint or Disable Breakpoint, Remove Breakpoint, Add Triggered Breakpoint…, Move Breakpoint to Group… and Breakpoints…; on a line that starts a lambda or, in JavaScript and TypeScript, a function, the menu also has Stop on the Line and Stop in Lambda n (see Lambda breakpoints). The editor’s right-click menu has a Breakpoints submenu with every breakpoint action for the line: Toggle Breakpoint, Toggle Temporary Breakpoint, Toggle Recording Breakpoint, Toggle Lambda Breakpoint on a line that starts a lambda, Add Logpoint, Add Triggered Breakpoint, Edit Breakpoint, Move Breakpoint to Group, Enable / Disable Breakpoint, then Breakpoints… and Mute Breakpoints. While the program is paused, the editor’s menu also has Run to Cursor, Force Run to Cursor, Show Value at Caret, Evaluate Expression and Add to Watches.
Click the gutter strip to toggle a breakpoint; Shift+click it to add a
logpoint. A breakpoint can’t be set on a blank line or on a line that holds only a
comment; the status bar says so. Removing one is always possible. A line with
only a closing } takes a breakpoint.
Removing a breakpoint that you set up asks nothing: one with a condition, a log
message, a hit count, a group or a filter, a method breakpoint or field
watchpoint with a condition, or an
exception breakpoint by type. The status bar
says it was removed, and
Edit: Undo Last Removal
(edit.undoRemoval, in the Edit menu; no key until you give it one) puts the
last one back as it was, with its condition, group and filters. It does the
same for a watch and a pinned value. When the breakpoint
can’t go back where it was (the file was closed, the line reads something else,
or a new breakpoint is on it), it says so and changes nothing. A plain
breakpoint isn’t recorded: a click sets it again.
Debug: Breakpoints… (C-c C-d l; Ctrl+Shift+F8 in the IntelliJ keymap,
⇧⌘F8 on macOS) lists every breakpoint. Each row has the gutter’s glyph for its kind, its file,
line and code, and below them what it does (its condition or log message) and
its folder, relative to the project (none for a file at the project root), or with
your home folder shortened to ~. With no breakpoints, the list says how to set
one. A breakpoint that waits for another says which, such as Waits until
shelf.js:12 is hit, and one in a group names it, such as
Group: checkout. Type to filter it, by file, code or group name; Enter jumps
to the selected breakpoint, Alt+E enables or disables it, Alt+D removes it,
Alt+G turns its whole group on or off, and Alt+M mutes them all. Java
method breakpoints and field watchpoints
are listed after the line breakpoints.
Debug: Mute Breakpoints (C-c C-d m) turns every breakpoint off without
removing it, until you run it again. It also stops exception breakpoints from
stopping the program; your caught and uncaught choices come back when you turn
it off. While breakpoints are muted, every glyph is faded, a glyph’s hover says
that none of them stops the program, Mute Breakpoints is checked in
Run ▸ Breakpoints, and the Debug window’s state line says “breakpoints muted”.
Editora keeps the choice for each project, so a muted project is still muted
when you open it again. Debug: Enable / Disable Breakpoint (C-c C-d t)
switches the breakpoint on the caret line. These commands are in
Run ▸ Breakpoints.
Debug: Break on Caught Exceptions stops wherever an exception is thrown, even one the program catches. Debug: Break on Uncaught Exceptions stops on an exception that nothing catches. Both are in Run ▸ Breakpoints, checked when on, and in the menu of the ⚠ button in the Debug window’s toolbar. While either is on, the ⚠ is drawn in the accent colour, and its tooltip says which are on. They act on the running session’s language, or else on the active file’s, and Editora keeps your choice for each project. To stop only on some Java exception classes, list them, separated by commas, in Exception breakpoints: only these classes on the Java card of Settings → Debugging (for example java.lang.IllegalStateException). Left blank, both stop on every exception.
At an exception stop, the line that threw is drawn red, the exception card opens under it, and the exception’s type and message are the top row of Variables.
Logpoints
A logpoint logs a message each time its line runs, and the program goes on
without stopping, like a print you don’t have to add to the code and remove
again. IntelliJ IDEA calls these non-suspending breakpoints with a log message,
and VS Code calls them logpoints.
To add one in a single step, Shift+click the breakpoint gutter on the line,
as in IntelliJ, or run Debug: Add Logpoint… (debug.addLogpoint;
C-c C-d g in the Emacs keymap) on the caret line. It is also in the editor’s
right-click Breakpoints submenu and in Run ▸ Breakpoints. A small form,
Add Logpoint with the file and line in its title, asks only for the
Log message. Put an expression in braces to include its value:
{item.name}: total = {total}. While the program is paused, the field completes
the {expression} at the caret, as the full
Edit Breakpoint form does.
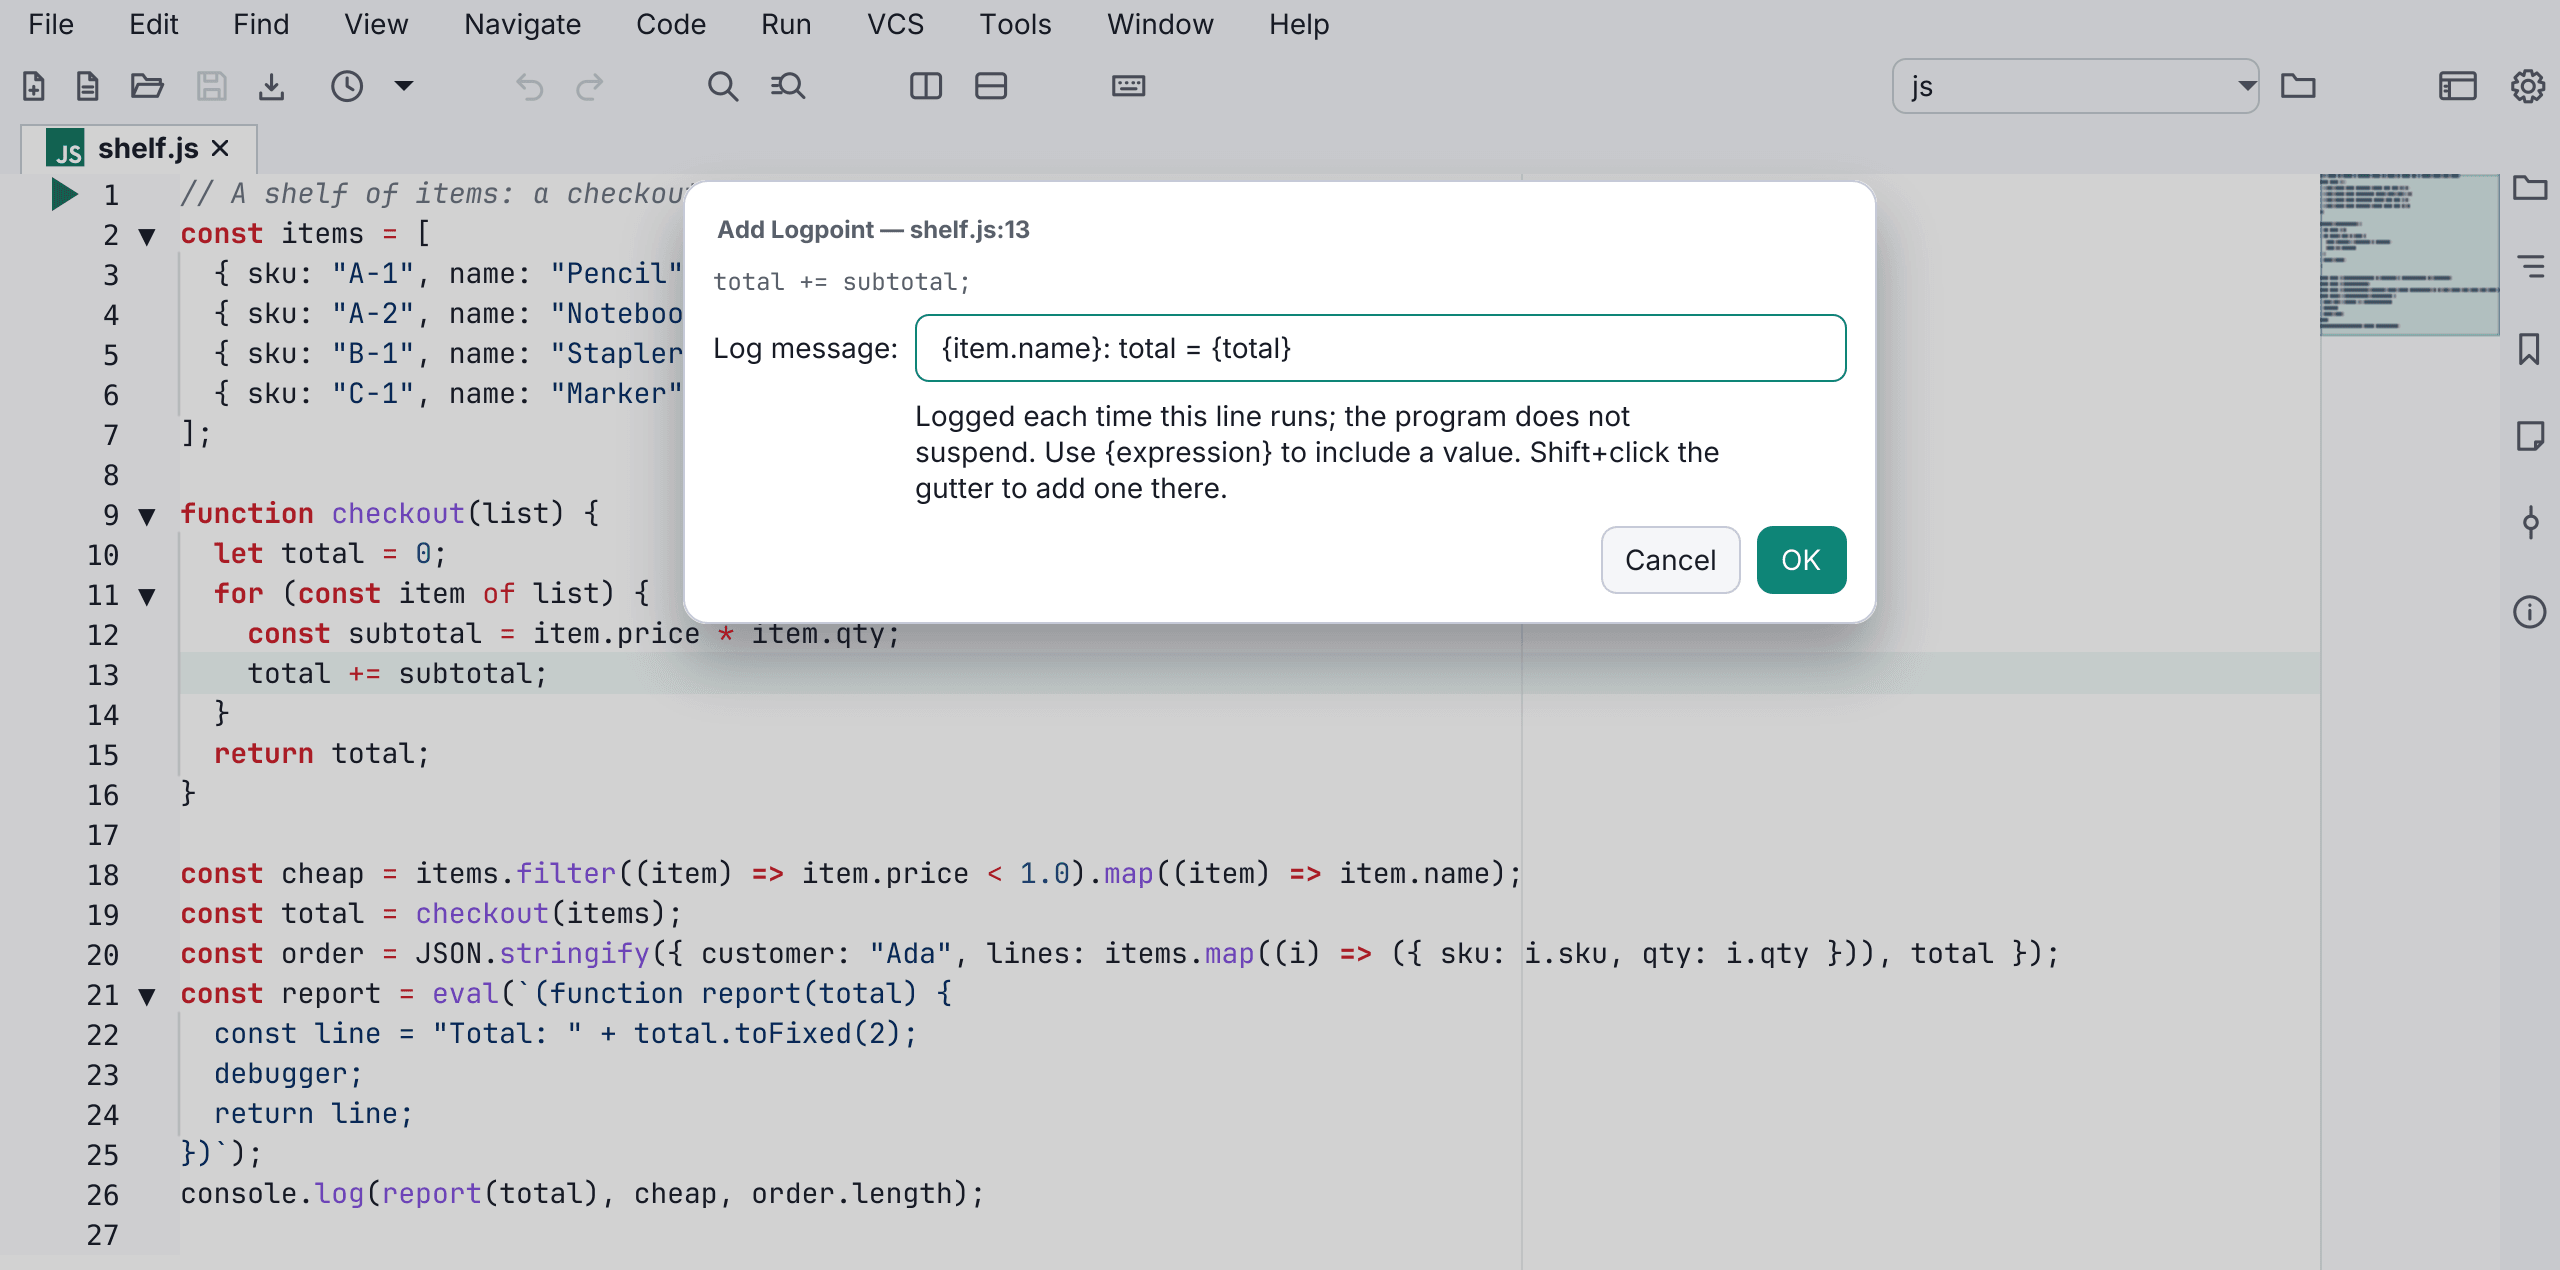
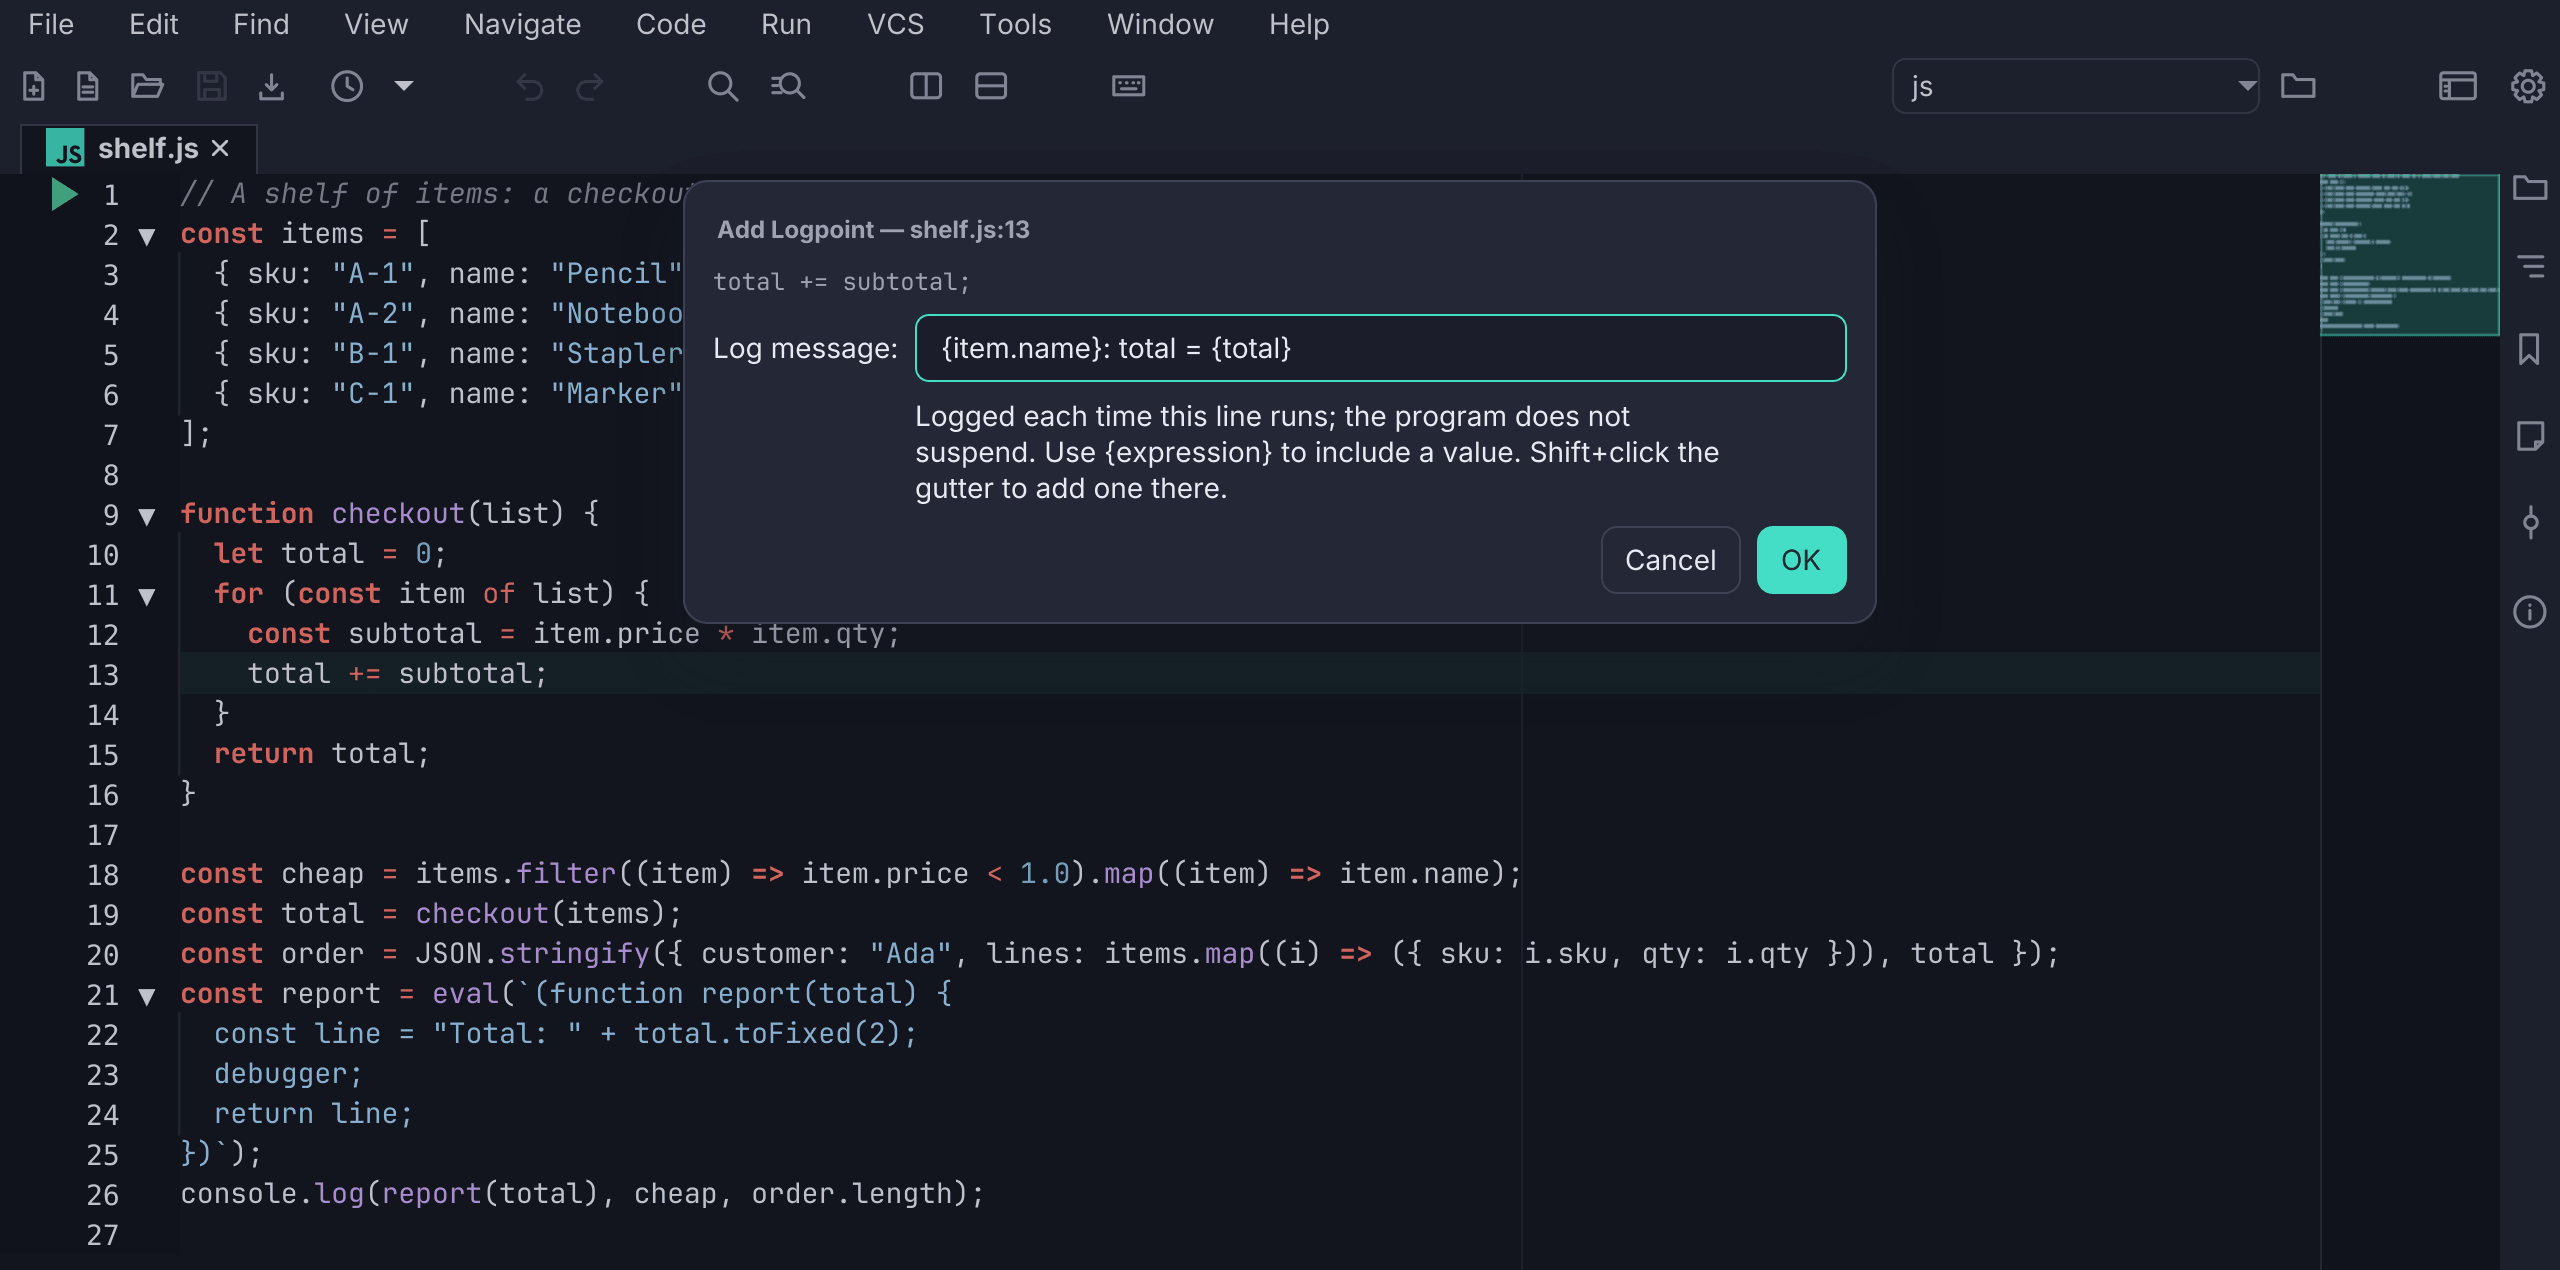
OK makes the line a logpoint, drawn as a blue diamond, and the status bar says it logs and never suspends. OK is greyed out while the message is blank, so the form never leaves a breakpoint that stops the program; Cancel adds nothing. On a line that already has a breakpoint, the form opens with its current message, and OK changes only the message: its condition and hit count stay. A line with no code is refused, as for a breakpoint. A plain click on the gutter still toggles an ordinary breakpoint.
Each time the line runs, the message, with the values filled in, appears in the Debug window’s console. A condition or a hit count, set in Edit Breakpoint, decides which runs of the line log.
A message can also say where it ran, with Visual Studio’s tracepoint tokens:
$FUNCTION for the function or method, $CALLER for the one that called it,
$CALLSTACK for the whole call stack (one frame per line, below the message),
and $TID and $TNAME for the thread’s id and name, as in
total = {total} in $FUNCTION, called from $CALLER. No debugger knows these
tokens, so a logpoint that uses one pauses the program briefly at each hit
while Editora writes the message, then lets it go on.
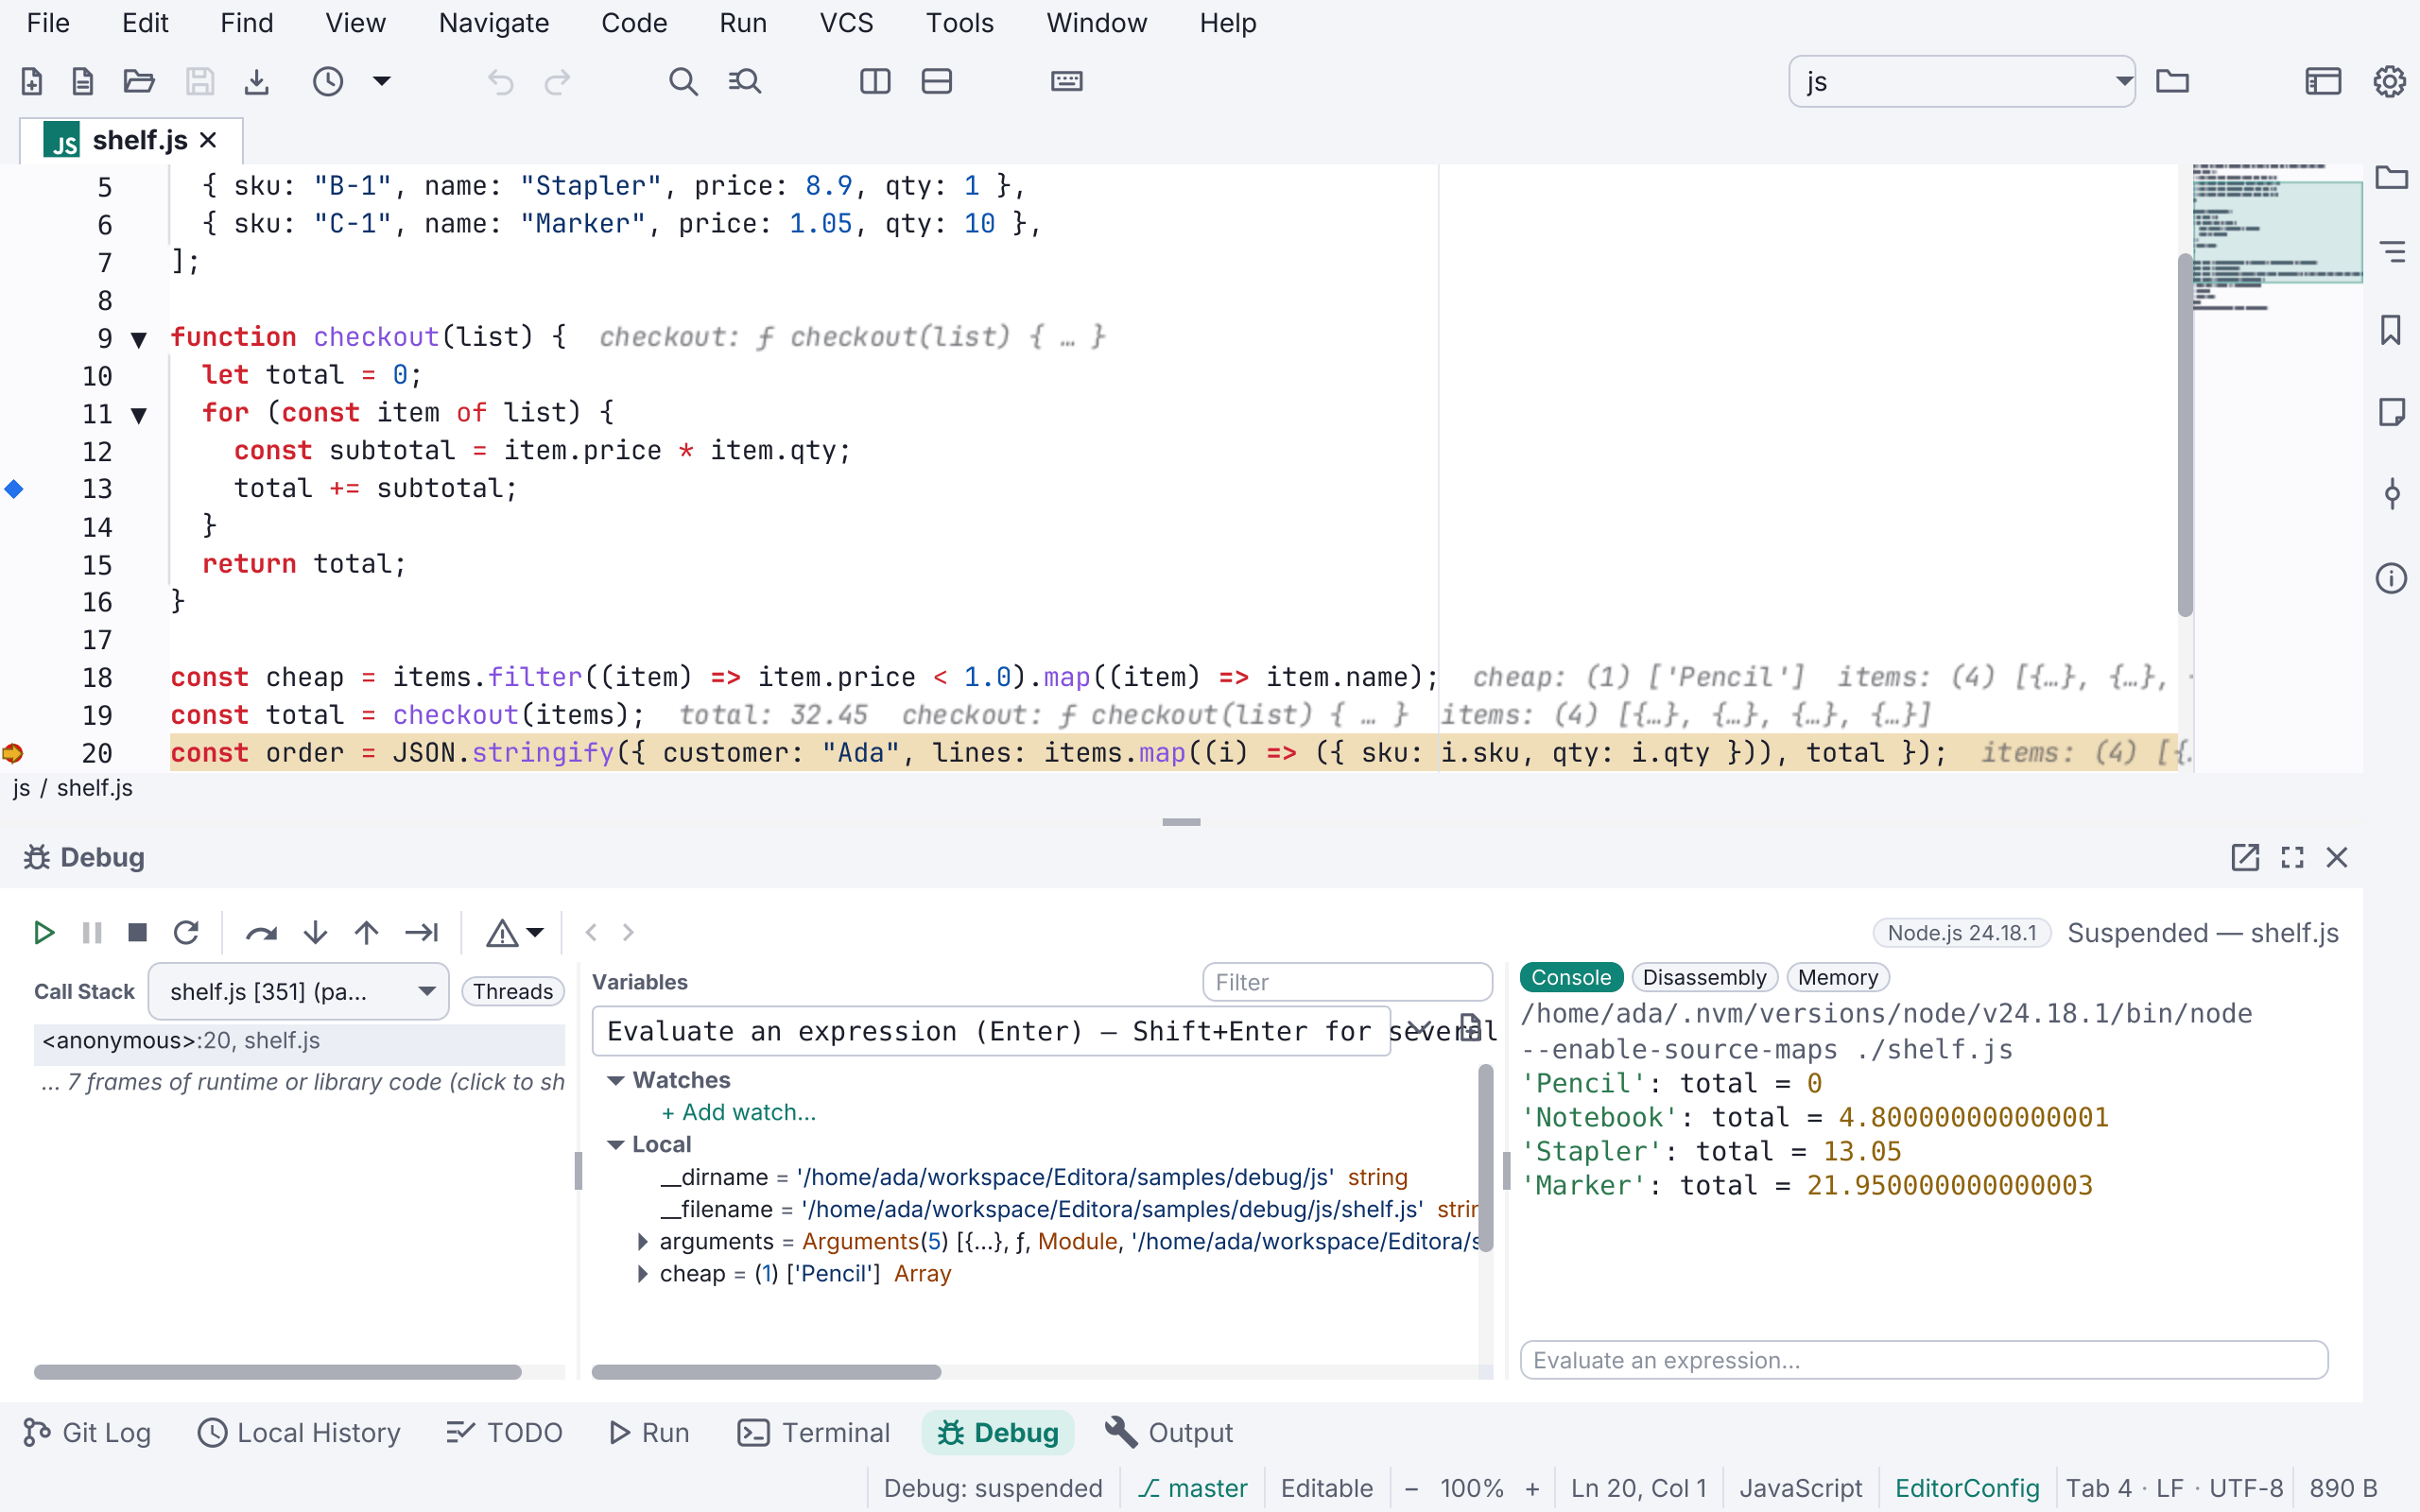
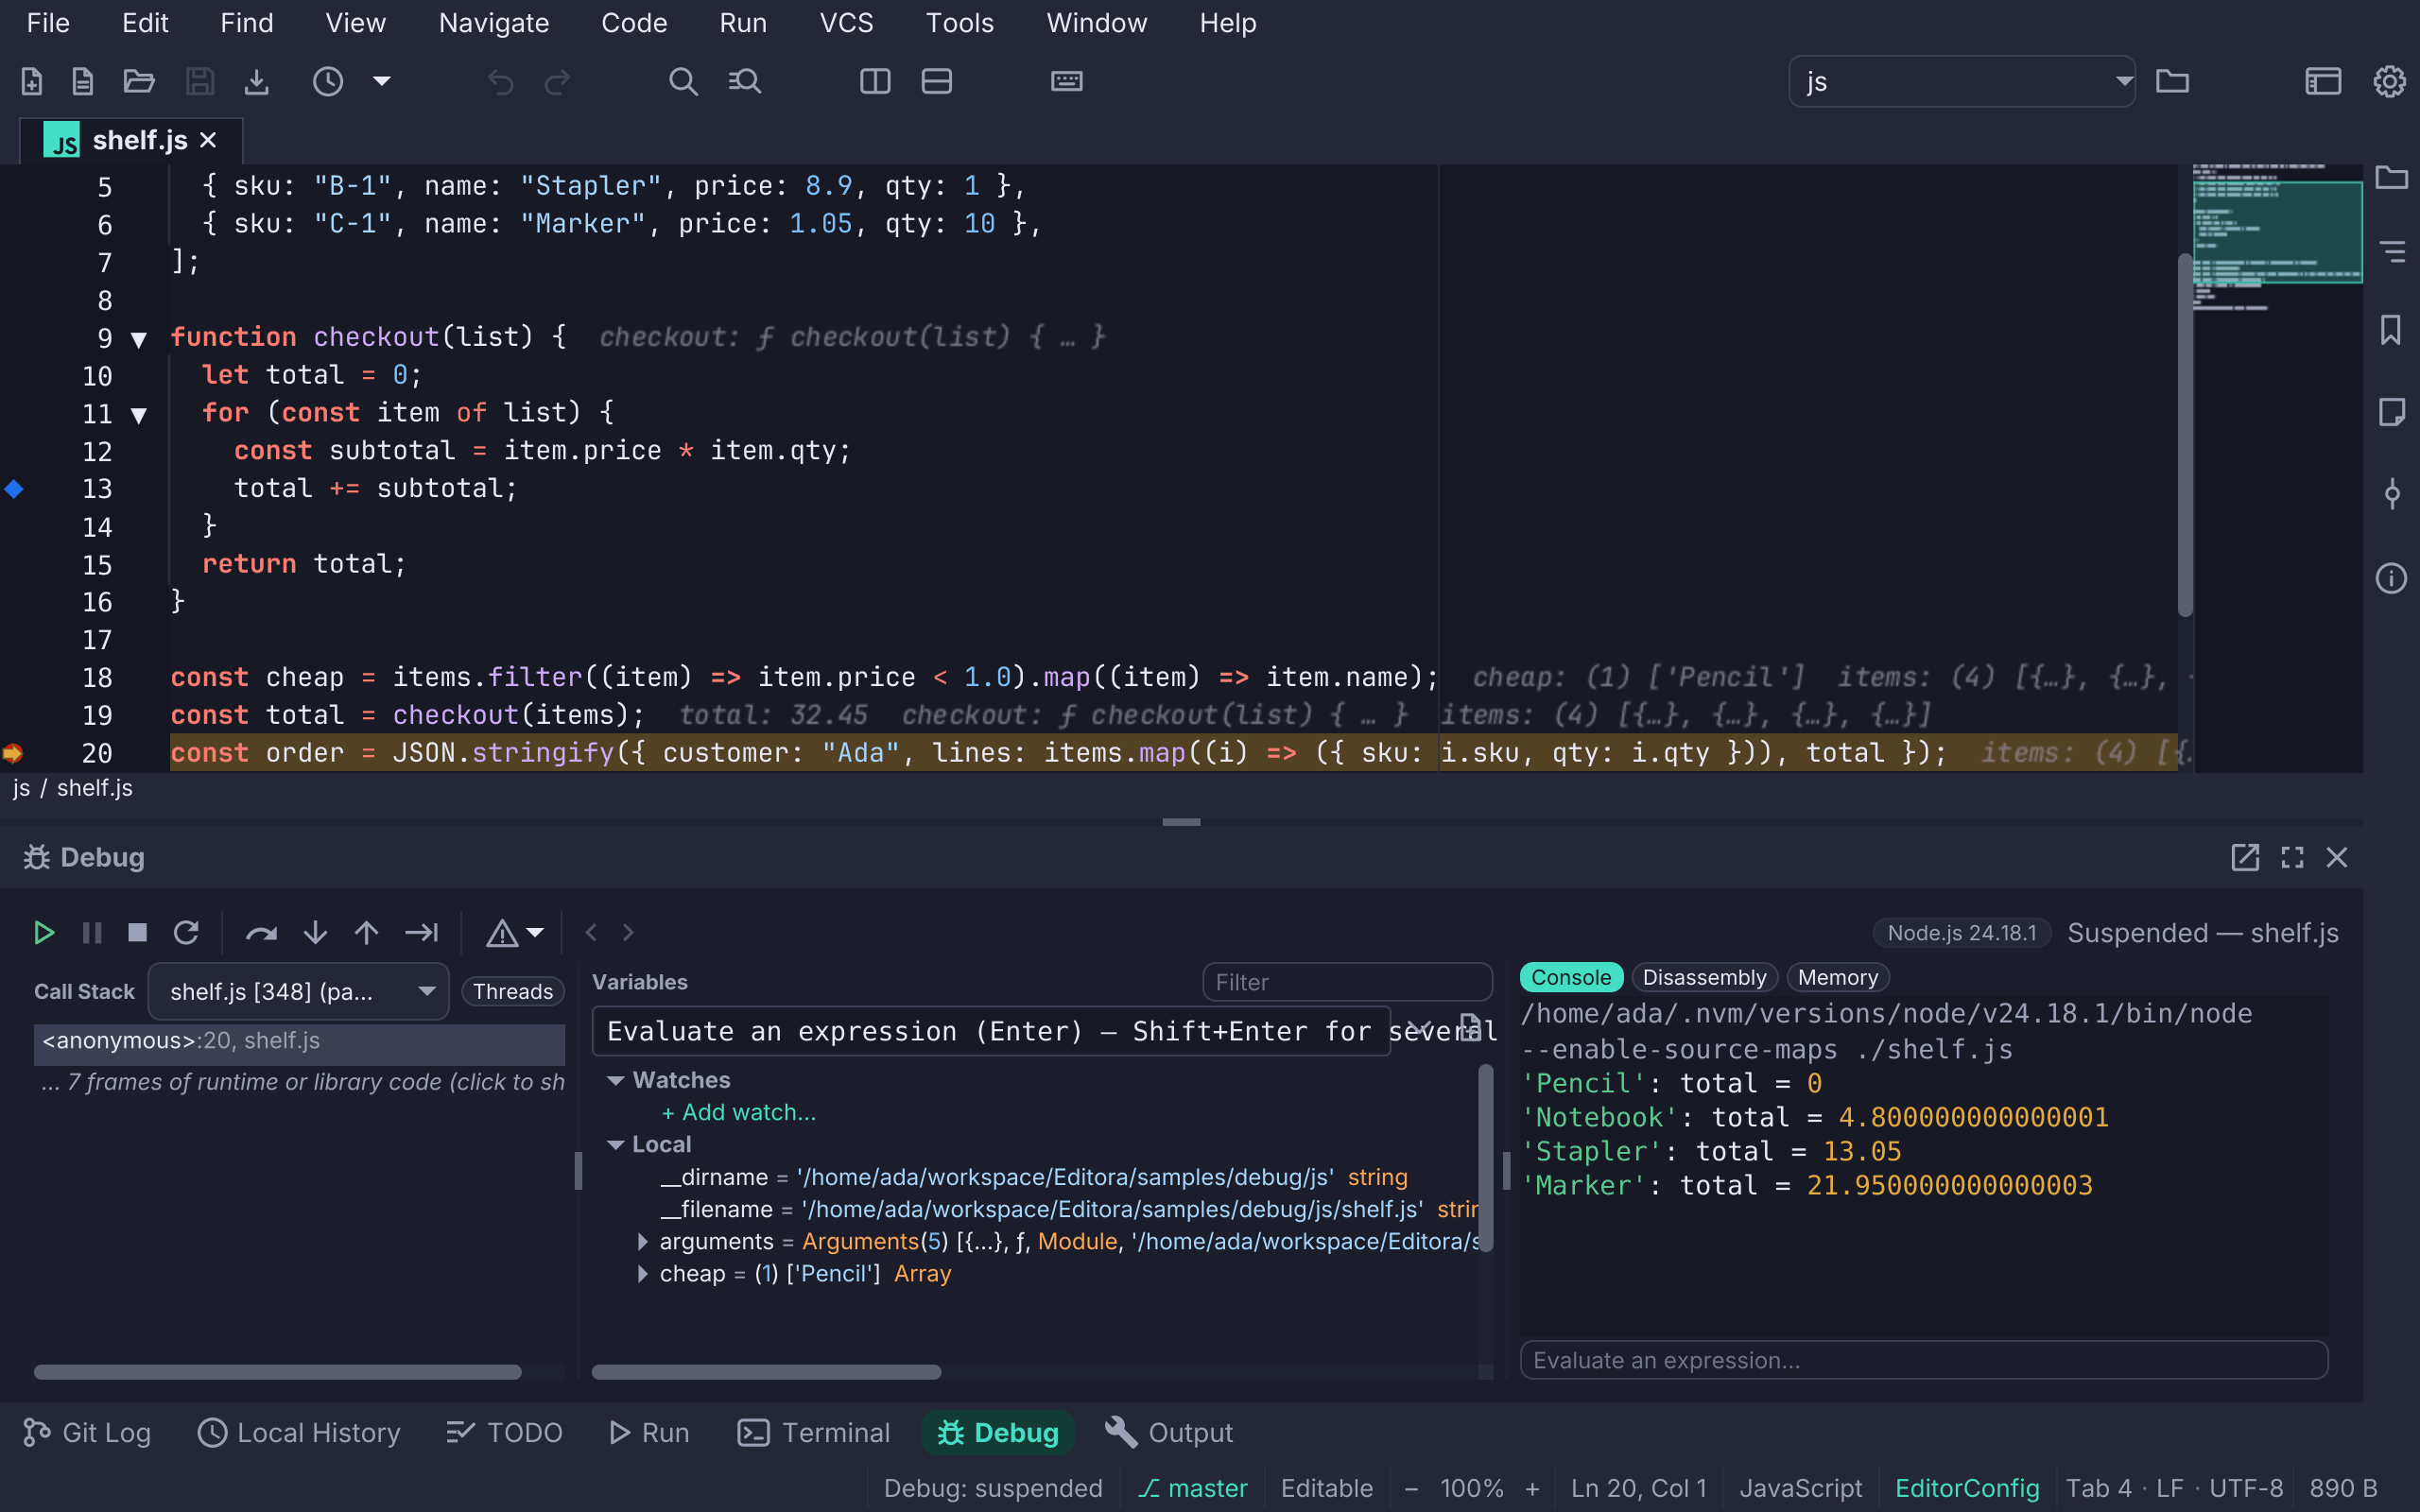
The Groovy, Kotlin and Scala debuggers don’t support logpoints yet (see their
sections below). netcoredbg, the C# debugger, doesn’t log them itself, so
Editora does: at each hit the program pauses briefly, each {expression} is
evaluated where it stopped, the message is written in the Debug console, and
the program goes on. The editor isn’t taken to the line, and the stop isn’t
kept in Debug History.
Temporary breakpoints
A temporary breakpoint is removed once the program stops on it, so it stops
the program only once. Debug: Toggle Temporary Breakpoint
(C-c C-d 1; Ctrl+Alt+Shift+F8 in the IntelliJ keymap, ⌥⇧⌘F8 on macOS) works
on the caret line:
- on a line without a breakpoint, it adds a temporary one;
- on a line with an ordinary breakpoint, it makes that breakpoint temporary, keeping its condition and hit count;
- on a line with a temporary breakpoint, it removes it.
The command is also in Run ▸ Breakpoints and the editor’s right-click Breakpoints submenu. In Edit Breakpoint, Remove once hit turns any breakpoint into a temporary one, or back.
A temporary breakpoint’s dot carries a “1” (one with a condition or a hit count shows the ”=” bars instead), and its hover and its row in Debug: Breakpoints… say Removed once hit. When the program stops on it, Editora removes it, also from the running session, and the status bar says Temporary breakpoint on line N hit and removed. A temporary breakpoint with a condition or a hit count is removed only when it actually stops the program. A logpoint never stops the program, so it is never removed.
Recording breakpoints
A recording breakpoint keeps a stop instead of staying stopped. Each time it is hit, Debug History keeps that stop, with its call stack, the stopped frame’s local values, your watches and the line’s inline values, and the program goes on at once. The editor does not jump to the line, and the Debug console notes each one as Recorded stop n: followed by where it was. Afterwards, Back, Forward and Show Value History read the recorded stops as any other, so you can follow how a value changed over many passes of a loop without stepping through each one. This is what Visual Studio’s tracepoints and IntelliJ’s non-suspending breakpoints do, with the values kept instead of logged.
Debug: Toggle Recording Breakpoint (debug.toggleRecordingBreakpoint, in
Run ▸ Breakpoints and the editor’s right-click Breakpoints submenu) works
on the caret line:
- on a line without a breakpoint, it adds a recording one;
- on a line with an ordinary breakpoint, it makes that breakpoint record, keeping its condition and hit count;
- on a line with a recording breakpoint, it removes it.
In Edit Breakpoint, Record and continue turns any breakpoint into a recording one, or back. A recording breakpoint is drawn purple with a ring, and its hover says Recorded in Debug History; the program goes on. A condition or a hit count still decides when it records. A logpoint never stops the program, so it records nothing.
A session records at most 500 stops. After that, a recording breakpoint stops the program as an ordinary one does, and the status bar says why. It also stops as usual when Debug History is turned off in Settings → Debugging → History, since there is nowhere to keep the stop.
Triggered breakpoints
A triggered breakpoint waits until another breakpoint is hit. Until then it does not stop the program; from then on it stops like any other breakpoint, for the rest of that debug session. The next session it waits again. Use one when a line runs often but only matters after something else has happened: a breakpoint in a loop that should stop only once a particular request has come in, for example. This is VS Code’s triggered breakpoint, IntelliJ IDEA’s Disable until hitting the following breakpoint and Visual Studio’s Only enable when the following breakpoint is hit.
Debug: Add Triggered Breakpoint… (debug.addTriggeredBreakpoint) works on
the caret line. It lists the other line breakpoints, with their file, line and
code; choose the one to wait for. The line gets a breakpoint if it has none,
and an ordinary one keeps its condition and hit count. The breakpoint it waits
for already is ticked, and choosing it again makes the breakpoint stop as
usual. The list leaves out any breakpoint that waits, directly or through
others, for this one, so two breakpoints never wait for each other. With no
other breakpoint to wait for, the status bar says to set that one first. The
command is in the palette, Run ▸ Breakpoints, the editor’s right-click
Breakpoints submenu and a breakpoint’s gutter menu. In Edit
Breakpoint, the Wait for field does the same; choose No other
breakpoint to stop waiting.
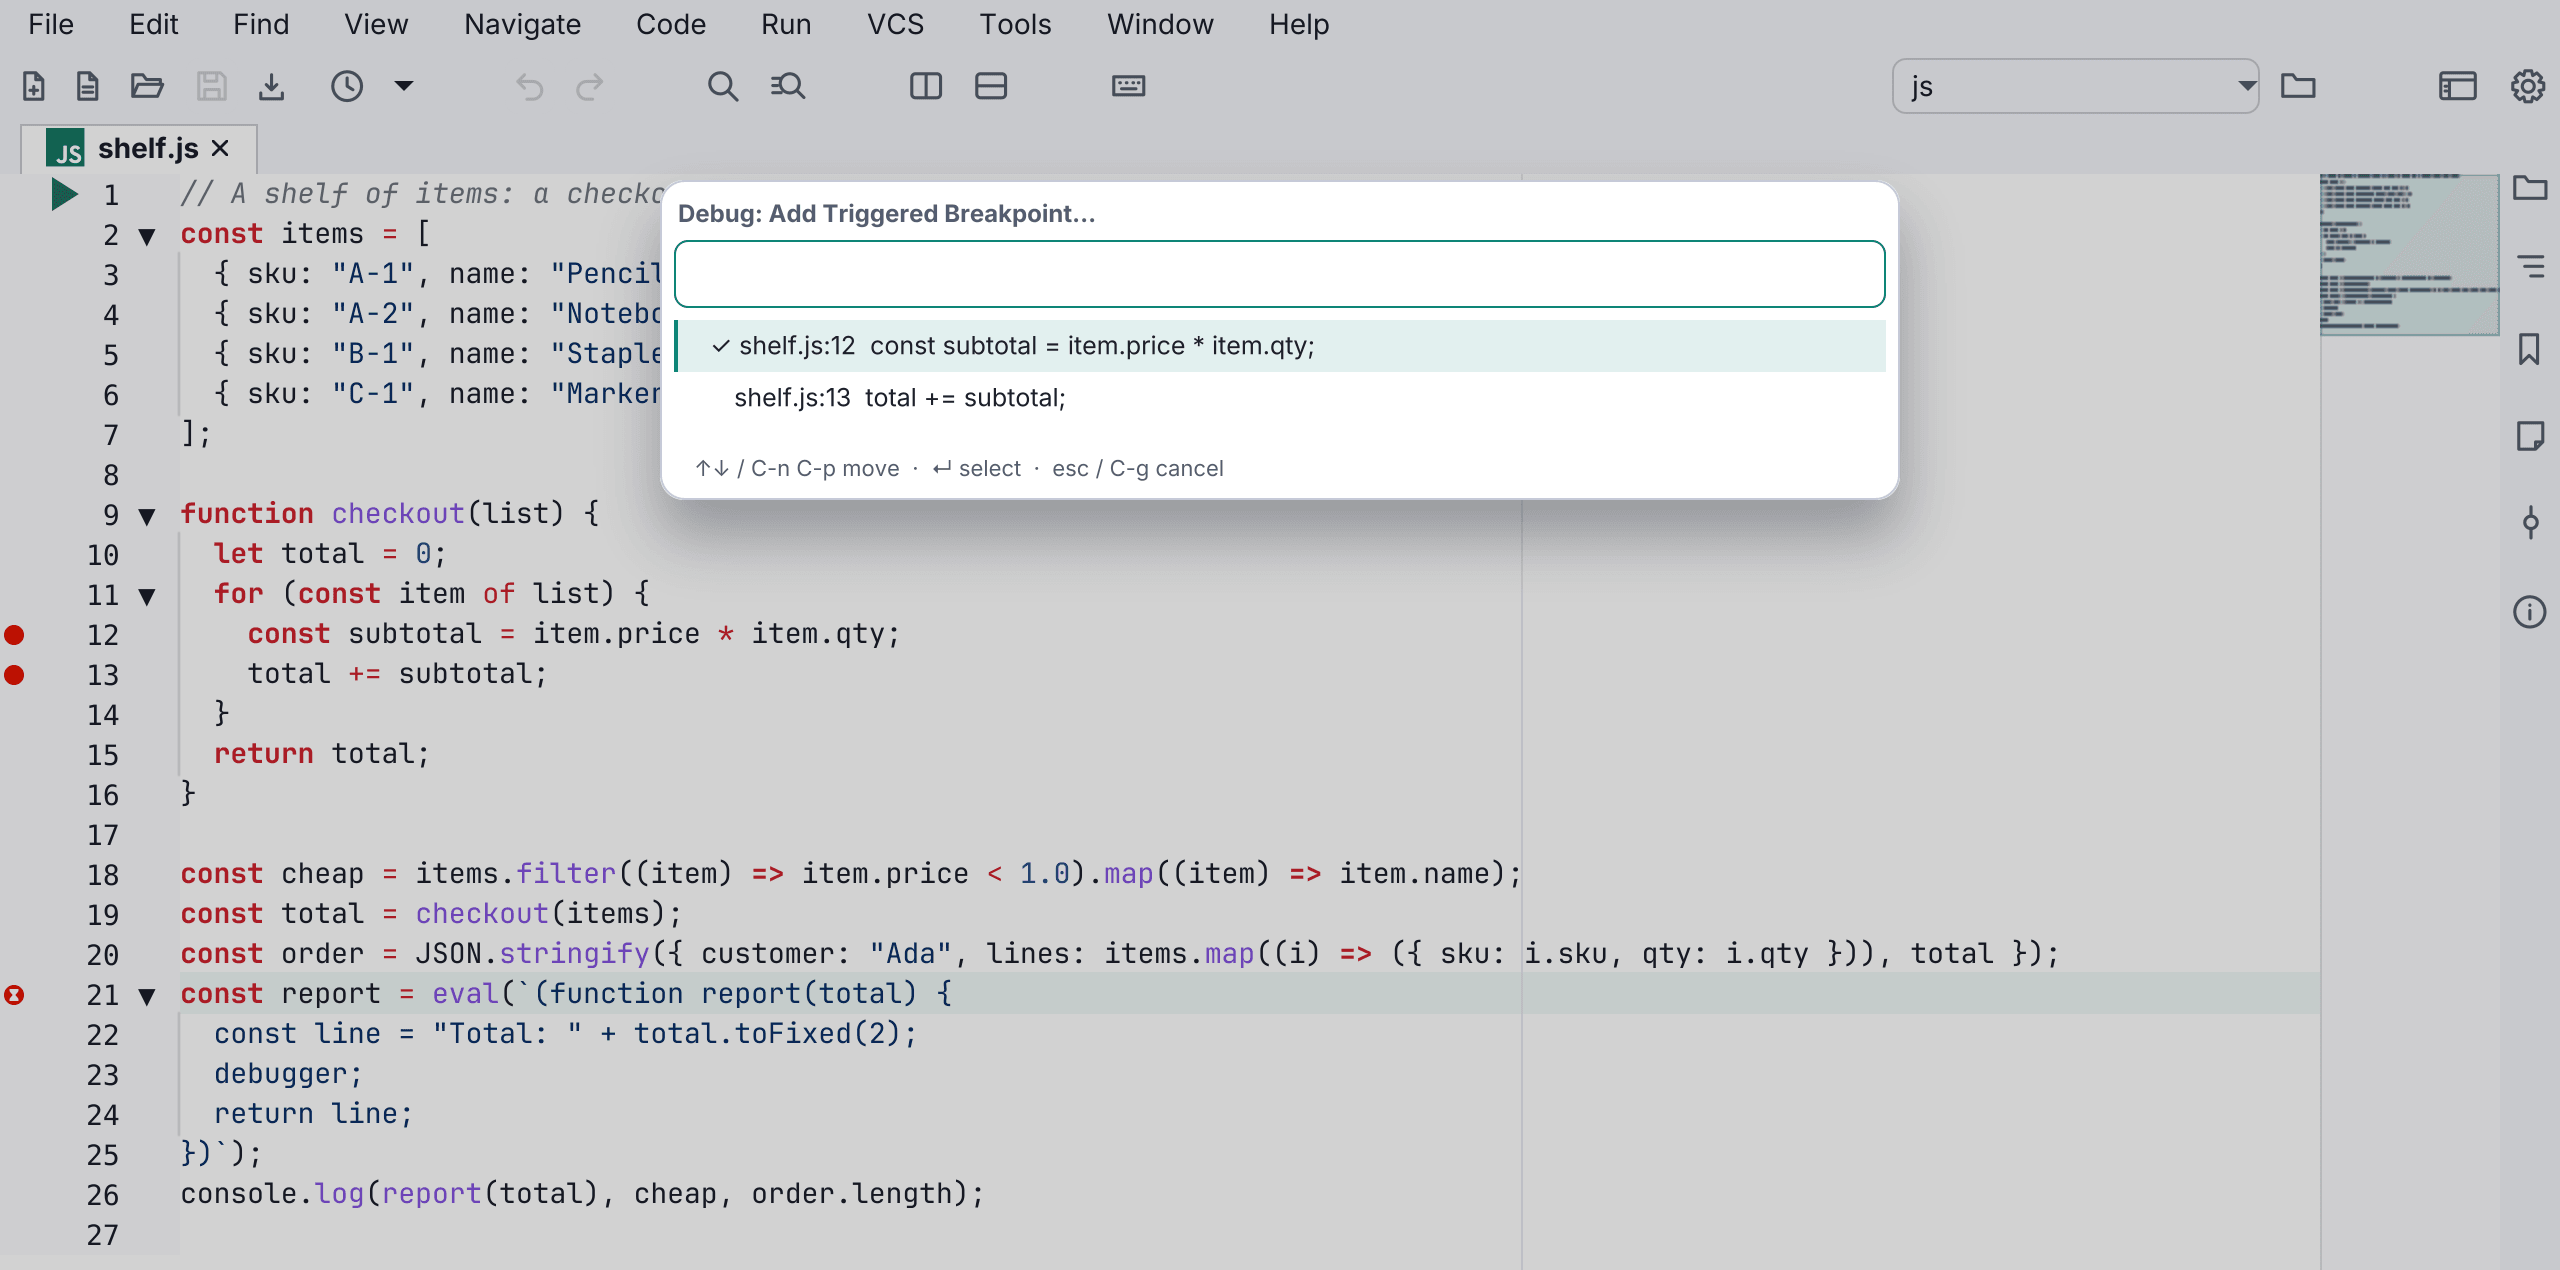
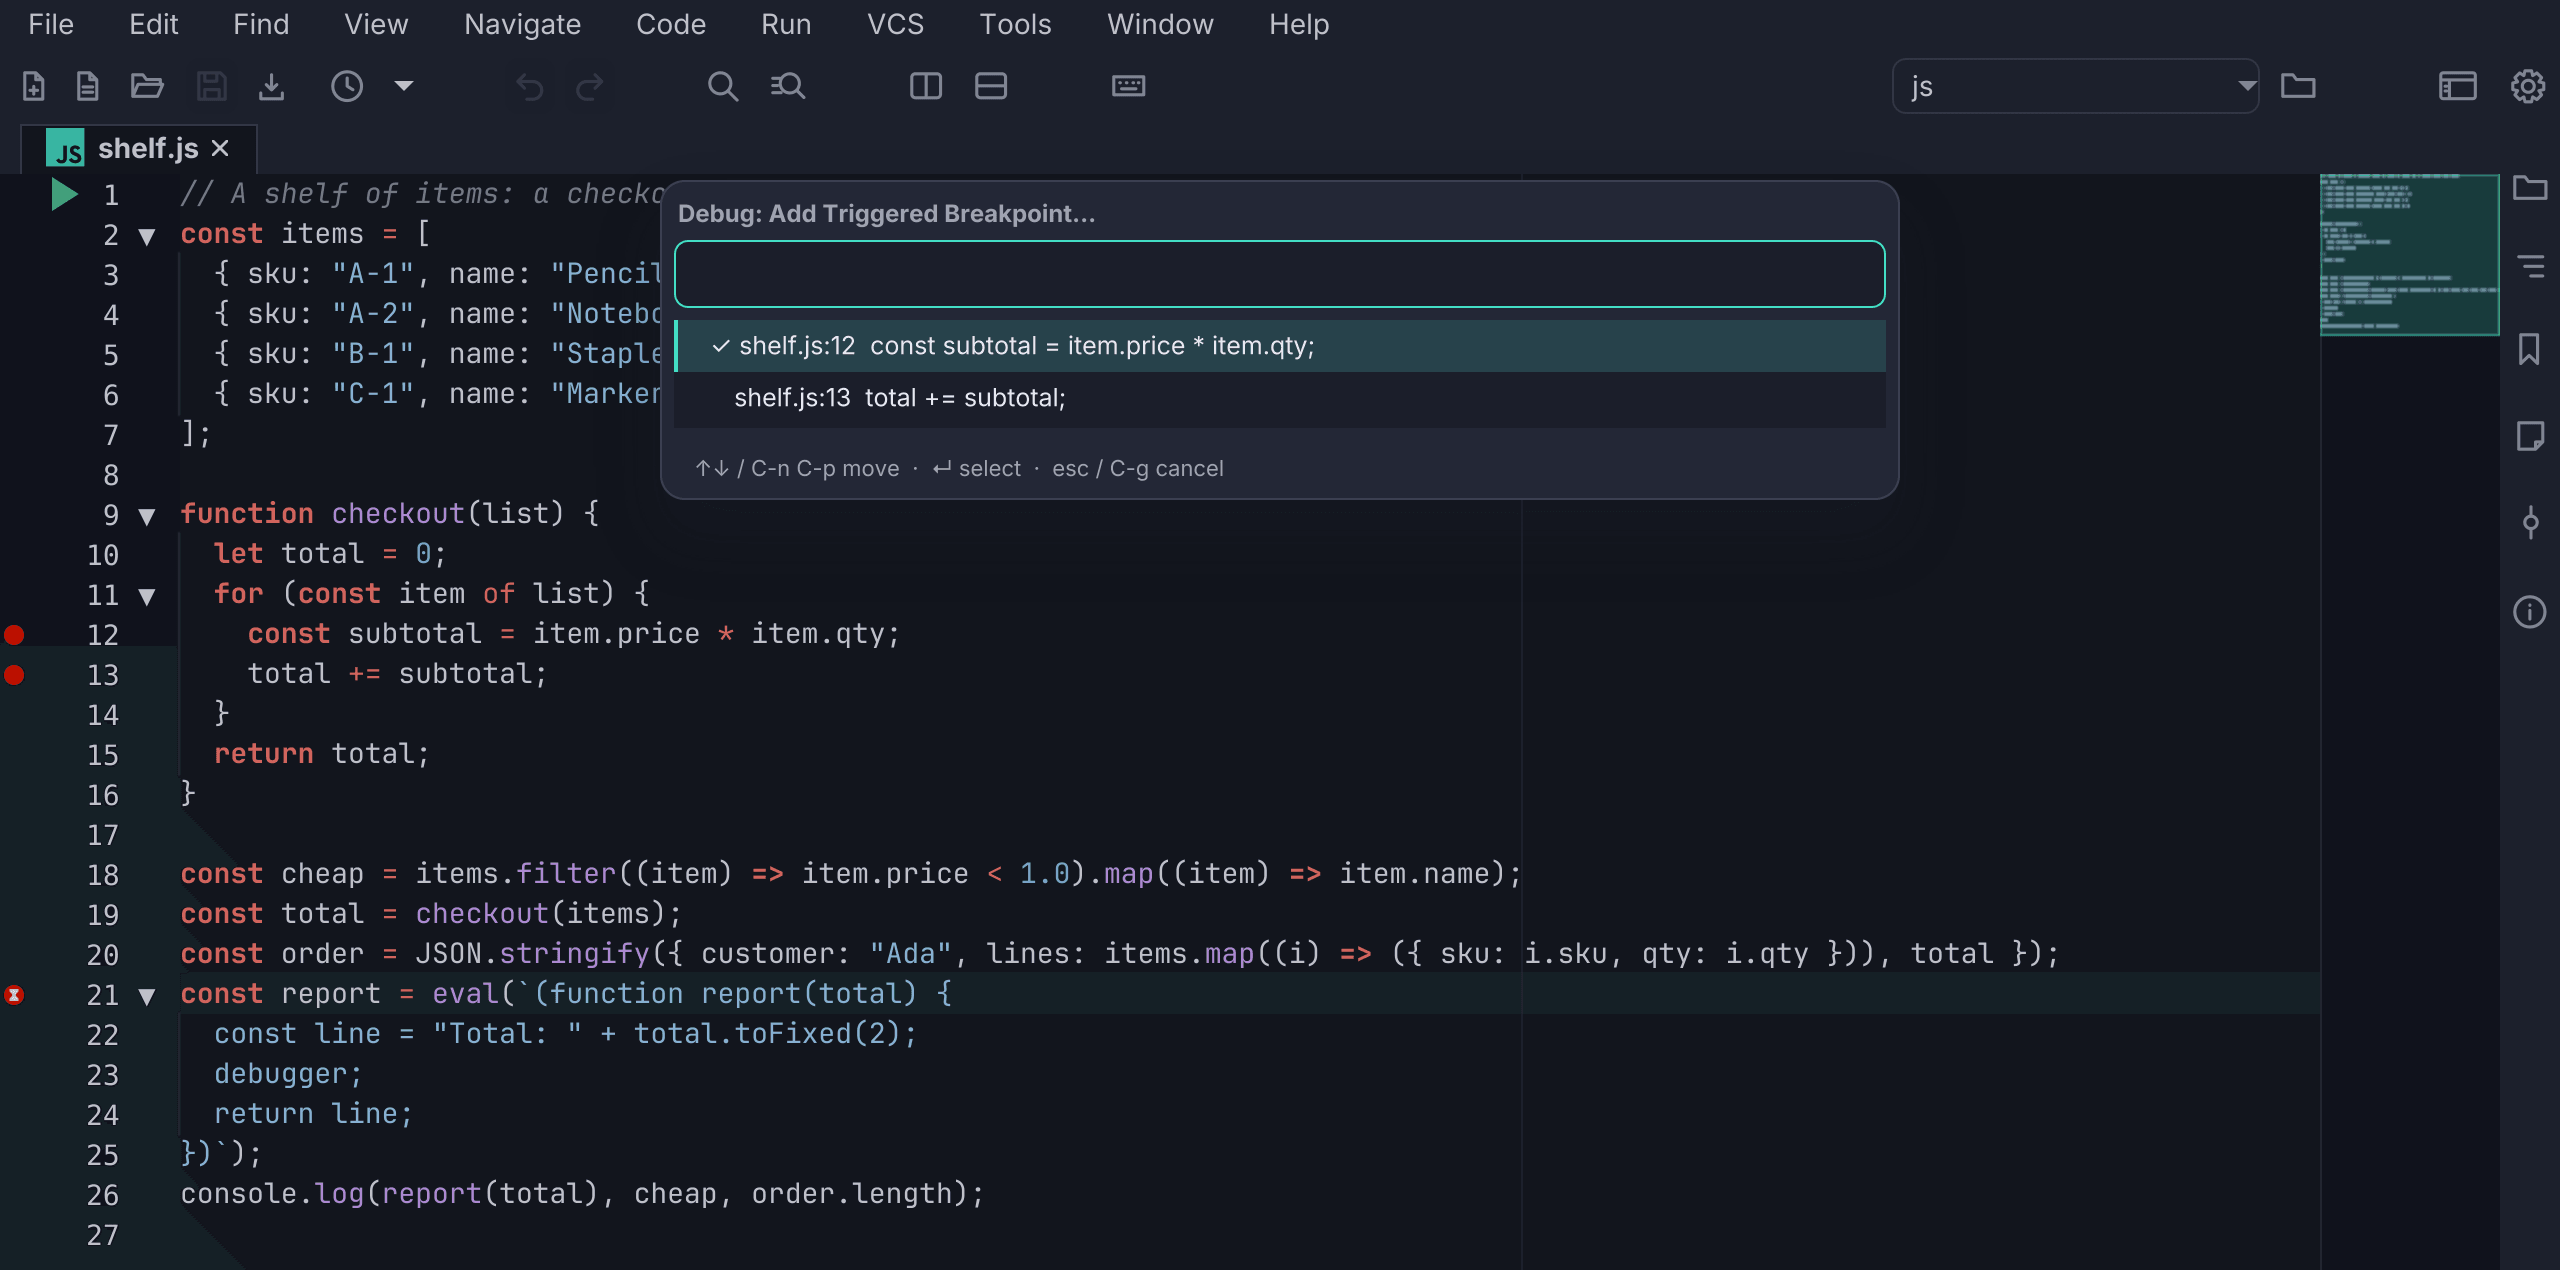
A triggered breakpoint carries an hourglass on its dot, and its hover says Waits until shelf.js:12 is hit. While a session runs and its trigger has not been hit, it is drawn hollow and its hover says Waiting: shelf.js:12 has not been hit in this session. When the trigger stops the program, the status bar and the Debug console say so, such as shelf.js:12 was hit: the breakpoint that waits for it now stops. A recording breakpoint can be a trigger too: it records the stop and lets the waiting breakpoints stop.
The waiting is done by Editora, not by the debugger, so triggered breakpoints work with every debugger Editora runs, and in files that are not open. They are saved with the project’s breakpoints, and the link holds when you edit the file and the lines move. If you remove the breakpoint it waits for, a triggered breakpoint becomes an ordinary one and stops at once. Only line breakpoints can be triggers; a method breakpoint or field watchpoint can’t.
Breakpoint filters
A breakpoint on a line many threads or callers pass through can be told to stop only for the ones you care about, as IntelliJ IDEA’s breakpoint filters do. Edit Breakpoint has three fields for it:
- Only in threads: stops only in threads whose name matches, such as
worker-*. - Only when called from: stops only when the function that called this one
matches, such as
OrderService.save. - Only on the object marked: stops only when
this(selfin Python, Ruby and Rust,$thisin PHP) is the object you gave that label with Mark Object.
Patterns are separated by commas, * and ? are wildcards, ! before a
pattern excludes it, and case is ignored: worker-*, !worker-0 is every
worker but the first. A breakpoint with filters is drawn as conditional, and
its hover and the breakpoints list name them, such as Only in threads:
worker-*.
The filters are checked by Editora, not by the debugger, so they work with every language. At each hit Editora looks at the thread, the caller and the object, and when one doesn’t match, lets the program go on without showing the stop. A filtered breakpoint’s hit count and log message count only the hits that pass the filters.
To stop on one object, mark it at the breakpoint’s first stop: while no object carries the label, the instance filter lets every hit through, and once one does, the next stops are that object’s.
Breakpoint groups
Breakpoints can be put in named groups, as in IntelliJ IDEA, and a whole group turned on or off at once: the breakpoints for one bug, or for one part of the program, can stay set while you work on something else.
Debug: Move Breakpoint to Group… (debug.moveBreakpointToGroup) asks for
the group of the caret line’s breakpoint: pick one of the groups there are,
type a new name, or leave it blank for none. It is in Run ▸ Breakpoints, the
editor’s right-click Breakpoints submenu and a breakpoint’s gutter menu. On
a line without a breakpoint, the status bar says so. In Edit Breakpoint,
the Group field does the same.
Debug: Enable / Disable Breakpoint Group… (debug.toggleBreakpointGroup)
lists the groups, each with how many breakpoints it has, ticked (✓) when all of
them are on and marked – when only some are. Choosing a group turns all its
breakpoints on, or all off when they are all on already. A running session is
told at once. Breakpoints in files that are not open follow too, and so do
method breakpoints and field watchpoints that came into a group from
an imported file.
In Debug: Breakpoints…, each row names its group, typing a group’s name lists its breakpoints, and Alt+G turns the selected row’s group on or off.
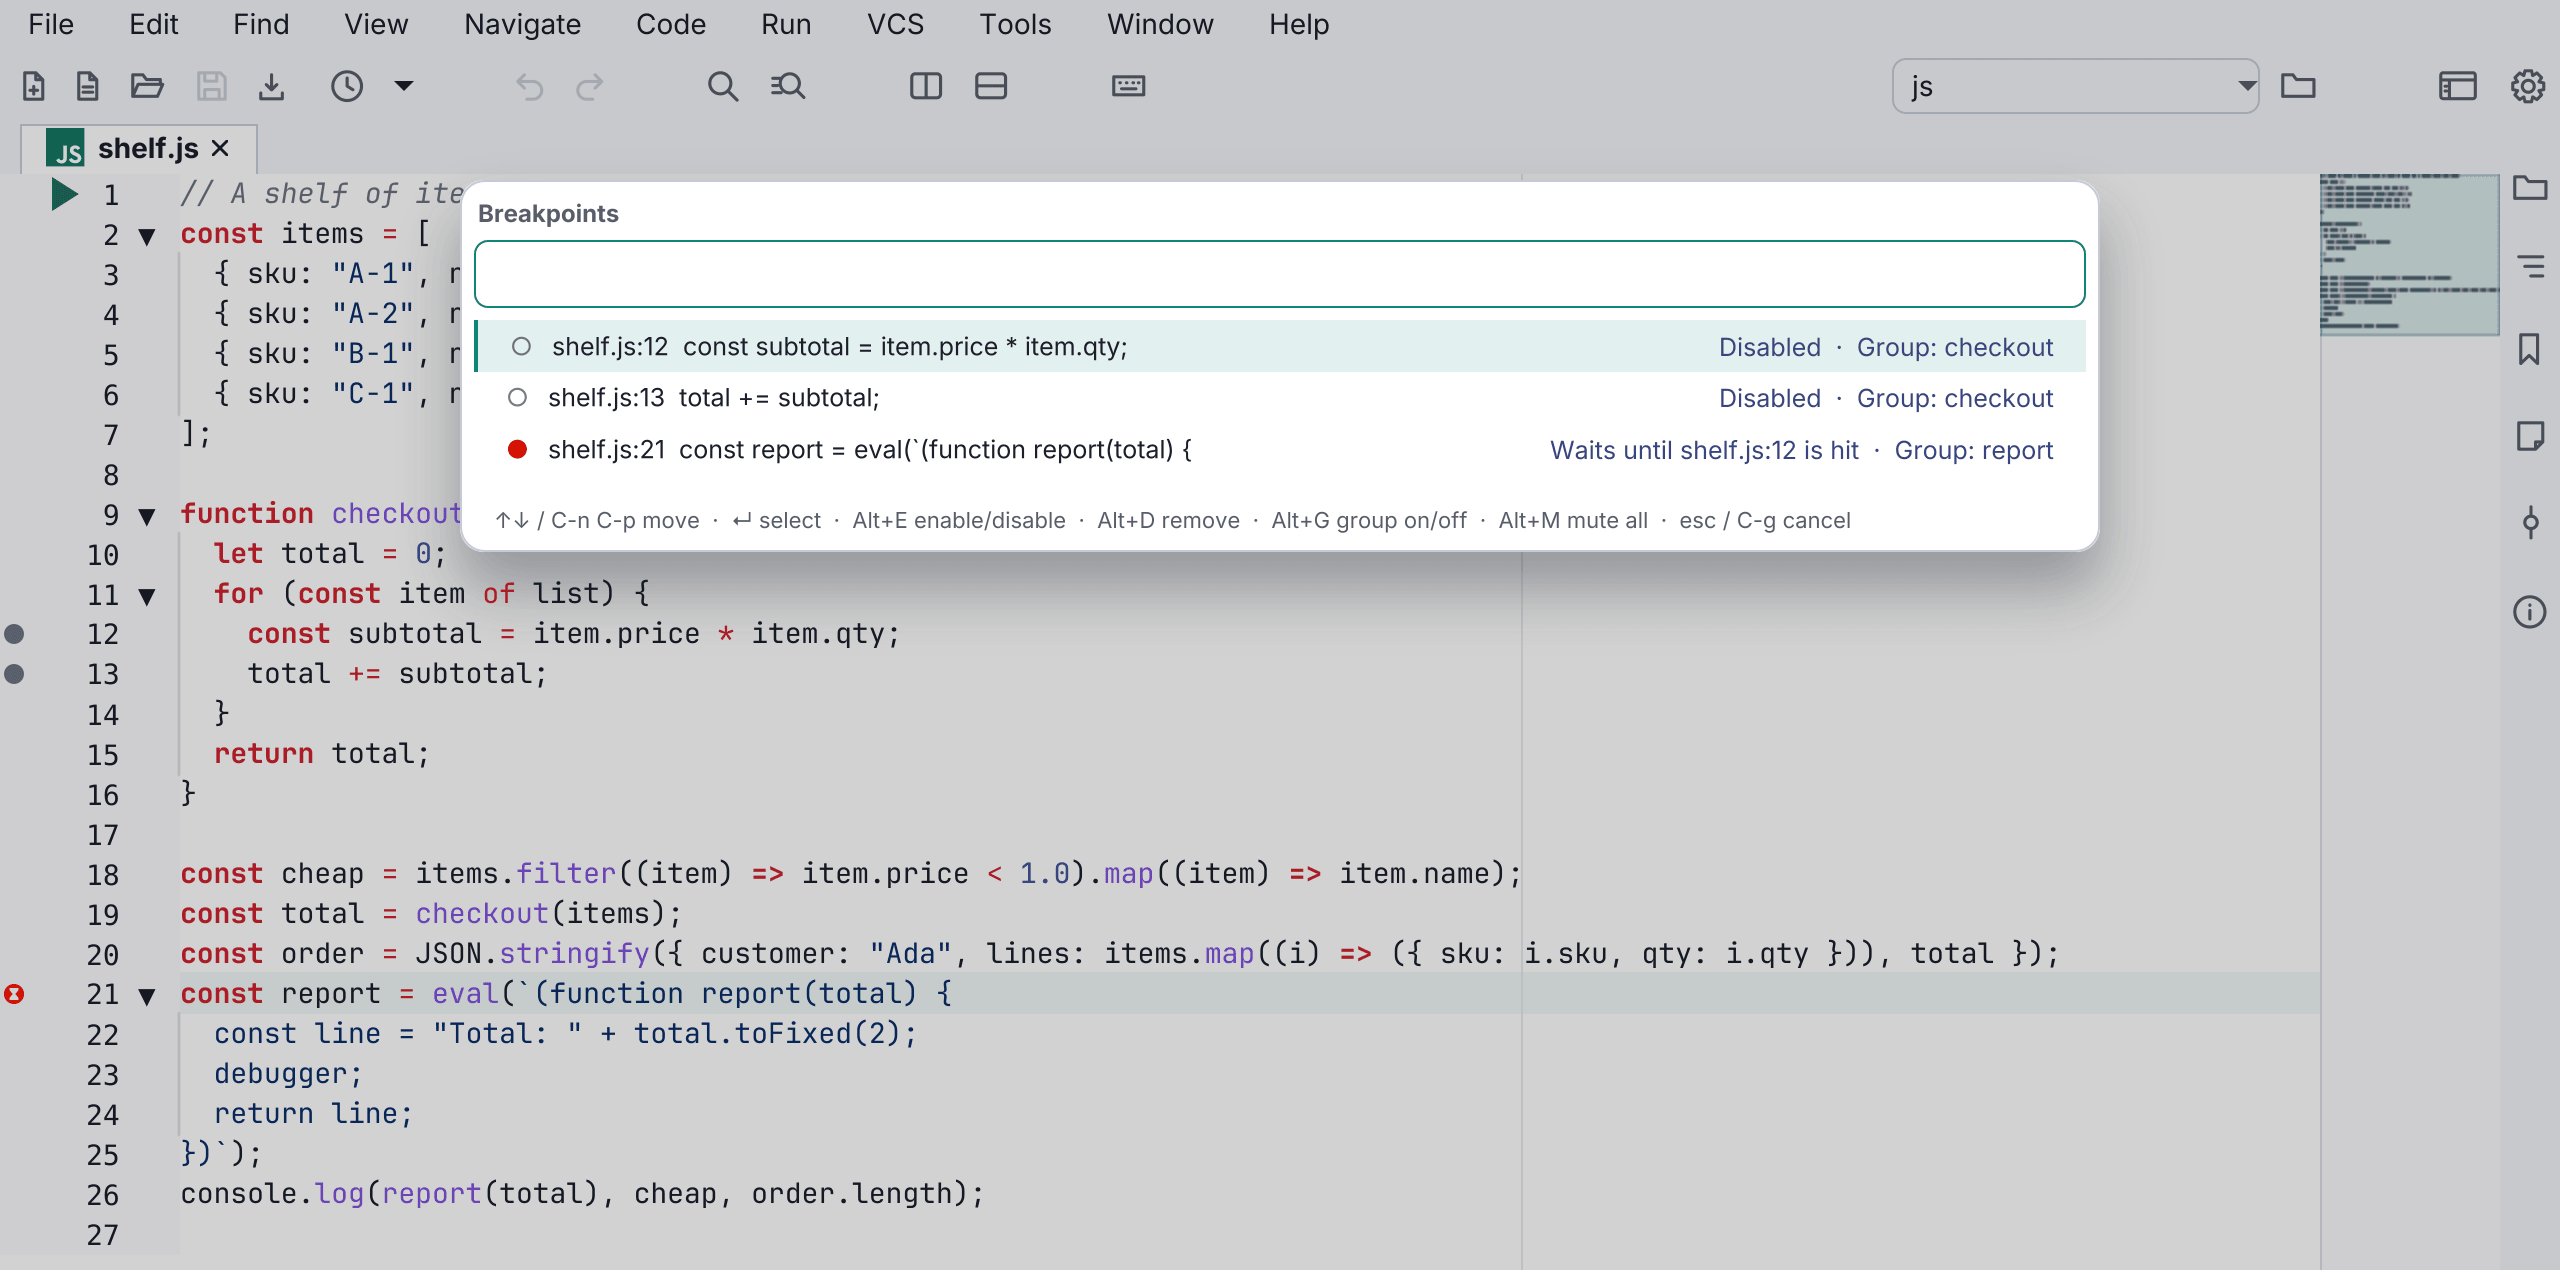
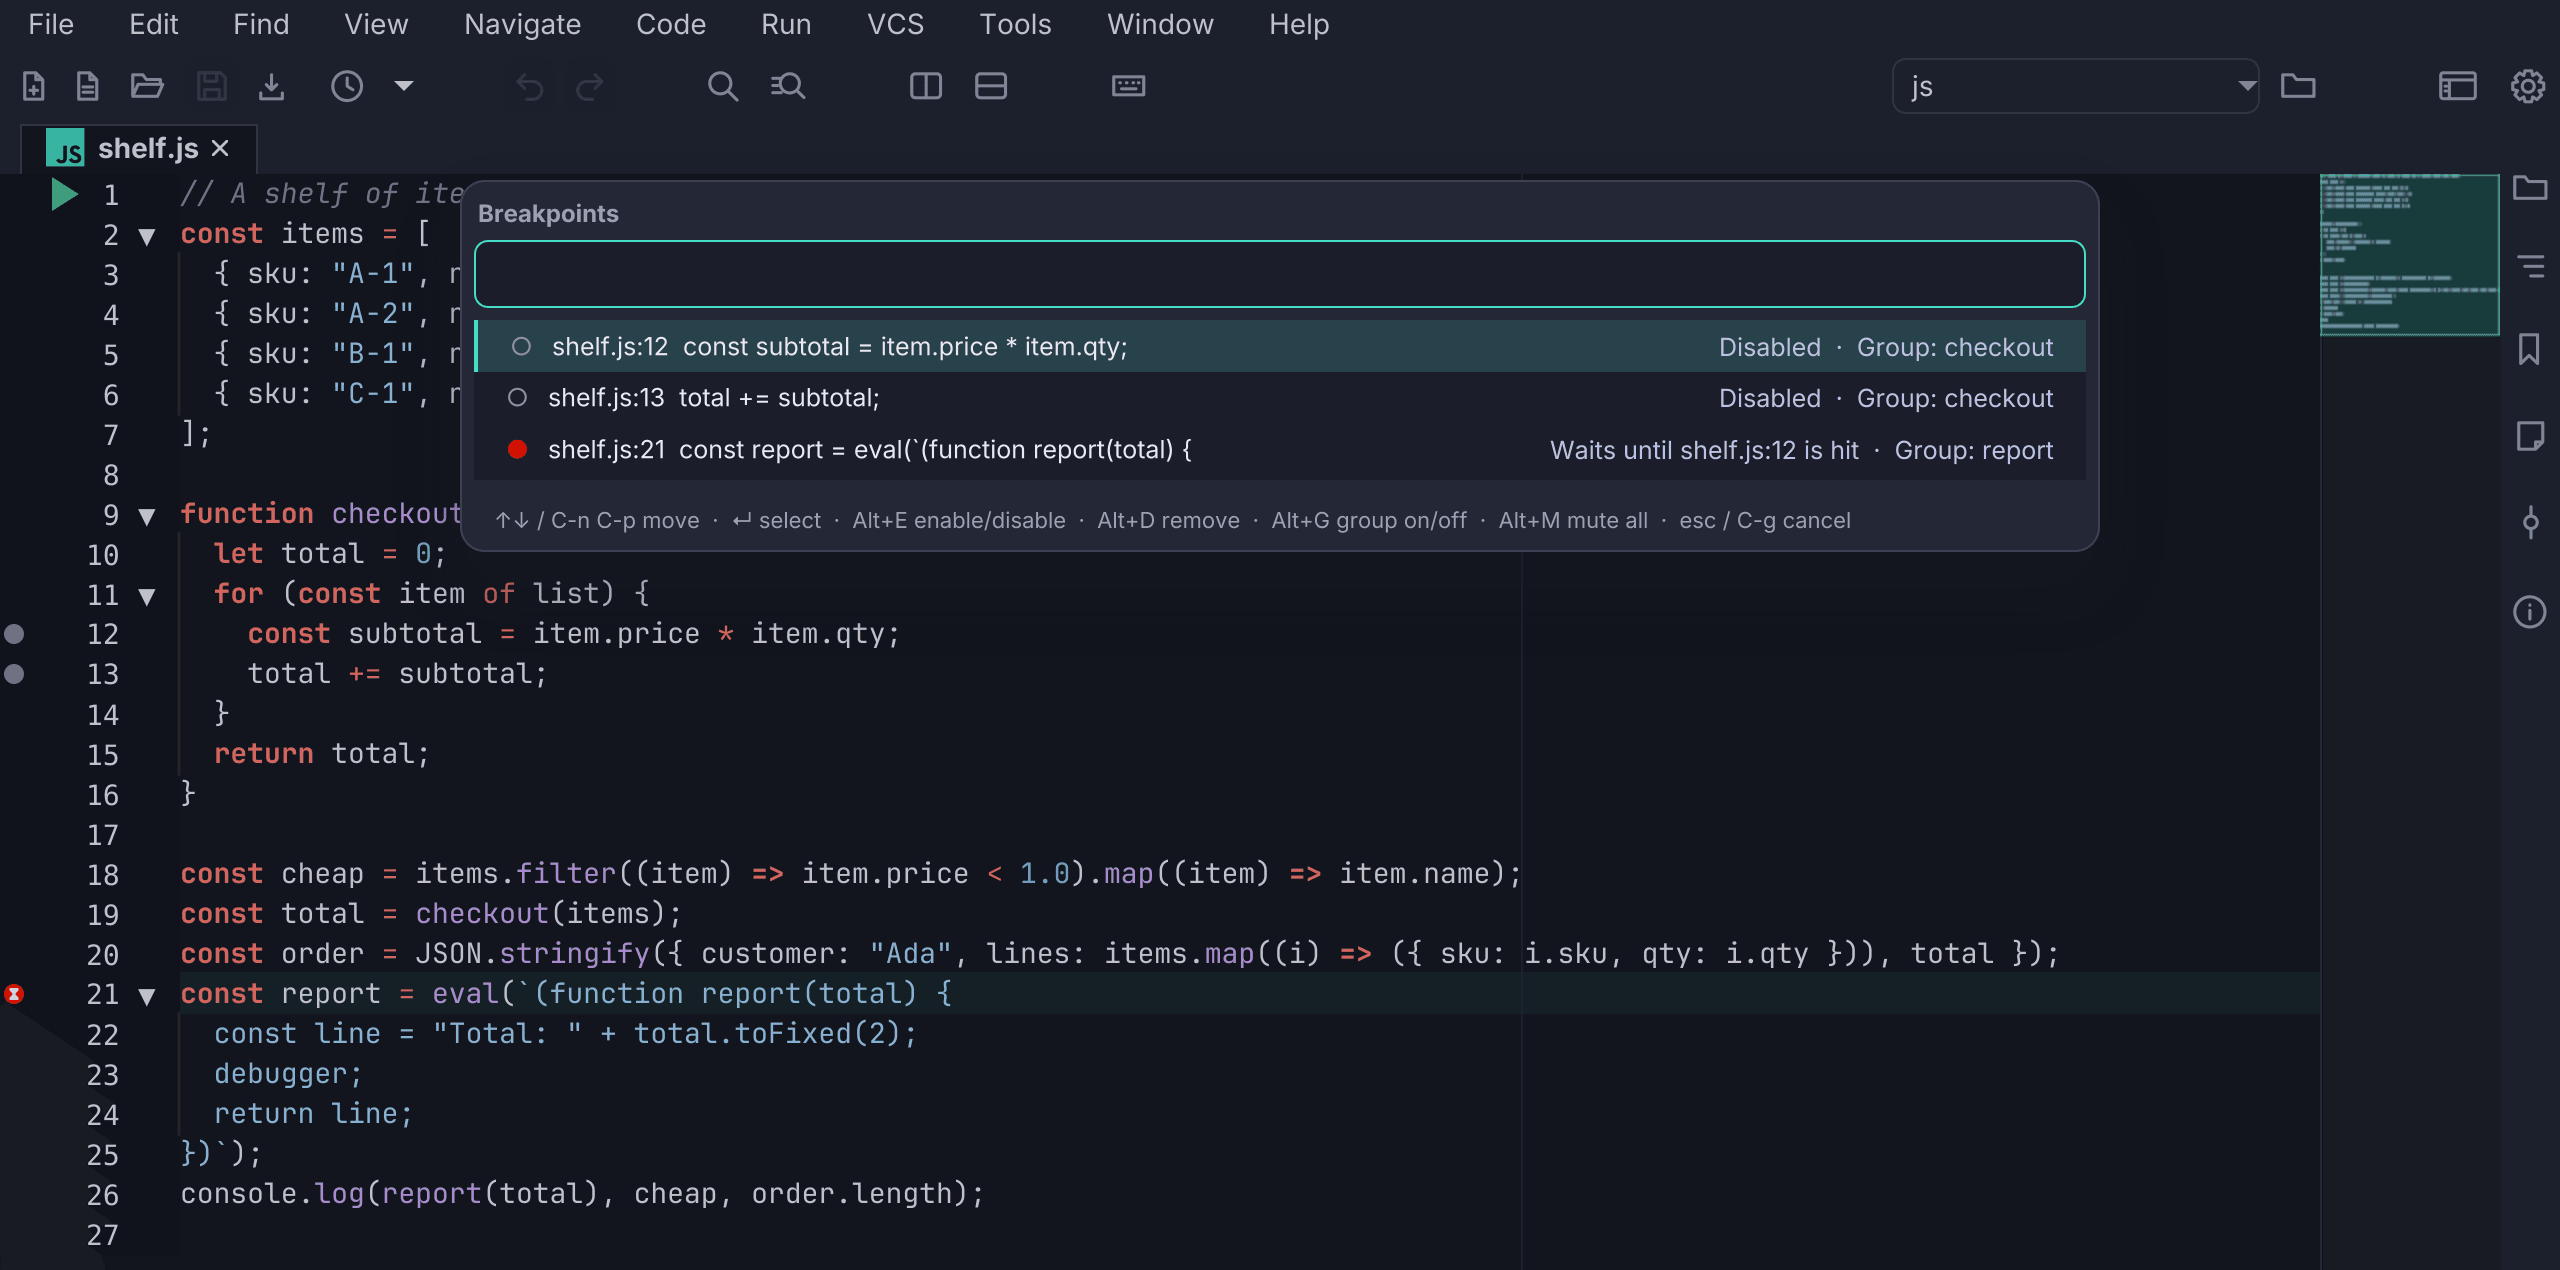
Exporting and importing breakpoints
Debug: Export Breakpoints… (debug.exportBreakpoints) writes your
breakpoints to a file you can keep, or share with a teammate, as Visual
Studio’s Export Breakpoints does. When some breakpoints are in groups, it first
asks whether to write all of them or one group’s. The file keeps each
breakpoint’s condition, log message, hit count, lambdas, whether it records or
is removed once hit, its group, and the breakpoint it waits for, along with
method breakpoints and field watchpoints. Files inside the project are written
relative to it, so the file works in another copy of the project. The code of a
line in an encrypted file is left out of it.
Debug: Import Breakpoints… (debug.importBreakpoints) sets the breakpoints
of such a file again. Each one goes on the line its code is on now, so edits
since the export don’t put it on the wrong line. A line that already has a
breakpoint keeps its own, and breakpoints in files that aren’t there are
skipped. The status bar counts them, such as Imported 5 breakpoints; 1 already
set, 0 in files not found. A running session gets the imported breakpoints at
once, in open files and closed ones. A file that isn’t an Editora breakpoints
file, or one written by a newer Editora, is refused, and nothing is imported.
Both commands are in Run ▸ Breakpoints and the palette.
Lambda breakpoints
In Java, a line breakpoint stops once, when its line runs, and never inside a
lambda on that line. On items.forEach(x -> System.out.println(x)); it
stops before forEach is called, not each time the lambda’s body runs, because the body
runs later, as code of its own. A lambda breakpoint stops there. In JavaScript
and TypeScript the same goes for arrow functions and function expressions:
on items.filter((item) => item.price < 1), a lambda breakpoint stops in
item.price < 1 once for each item.
Debug: Toggle Lambda Breakpoint (debug.toggleLambdaBreakpoint) sets a
breakpoint that stops inside the lambda the caret is in, or the first one on
the caret’s line, each time its body runs, with the lambda’s parameters in
Variables. Its keys are Shift+F9 (⇧F9 on macOS) in the VS Code, CUA and Sublime
Text keymaps and C-c C-d S-l in the Emacs keymap. It is in
Run ▸ Breakpoints, and in the editor’s right-click Breakpoints submenu on
a line that starts a lambda.
- On a line without a breakpoint, it adds one that stops only in that lambda.
- On a line with a breakpoint, it adds that lambda to the places it stops.
- On a lambda the breakpoint already stops in, it takes the lambda away, and removes the breakpoint when it stops nowhere else.
The status bar says which, such as Breakpoint in lambda 1 on line 12. On a line that starts no lambda, it says so, and in other languages it says lambda breakpoints are for Java, JavaScript and TypeScript files.
Right-click a breakpoint’s dot on a line with lambdas to choose where it
stops, in any combination: Stop on the Line (Debug: Toggle Stop on the
Line, debug.toggleStopOnLine, on the caret’s line), and Stop in Lambda 1,
Stop in Lambda 2… for each lambda the line starts, numbered from the left,
each followed by the start of its lambda.
At least one stays on: with no lambda checked, the breakpoint stops on the line
again.
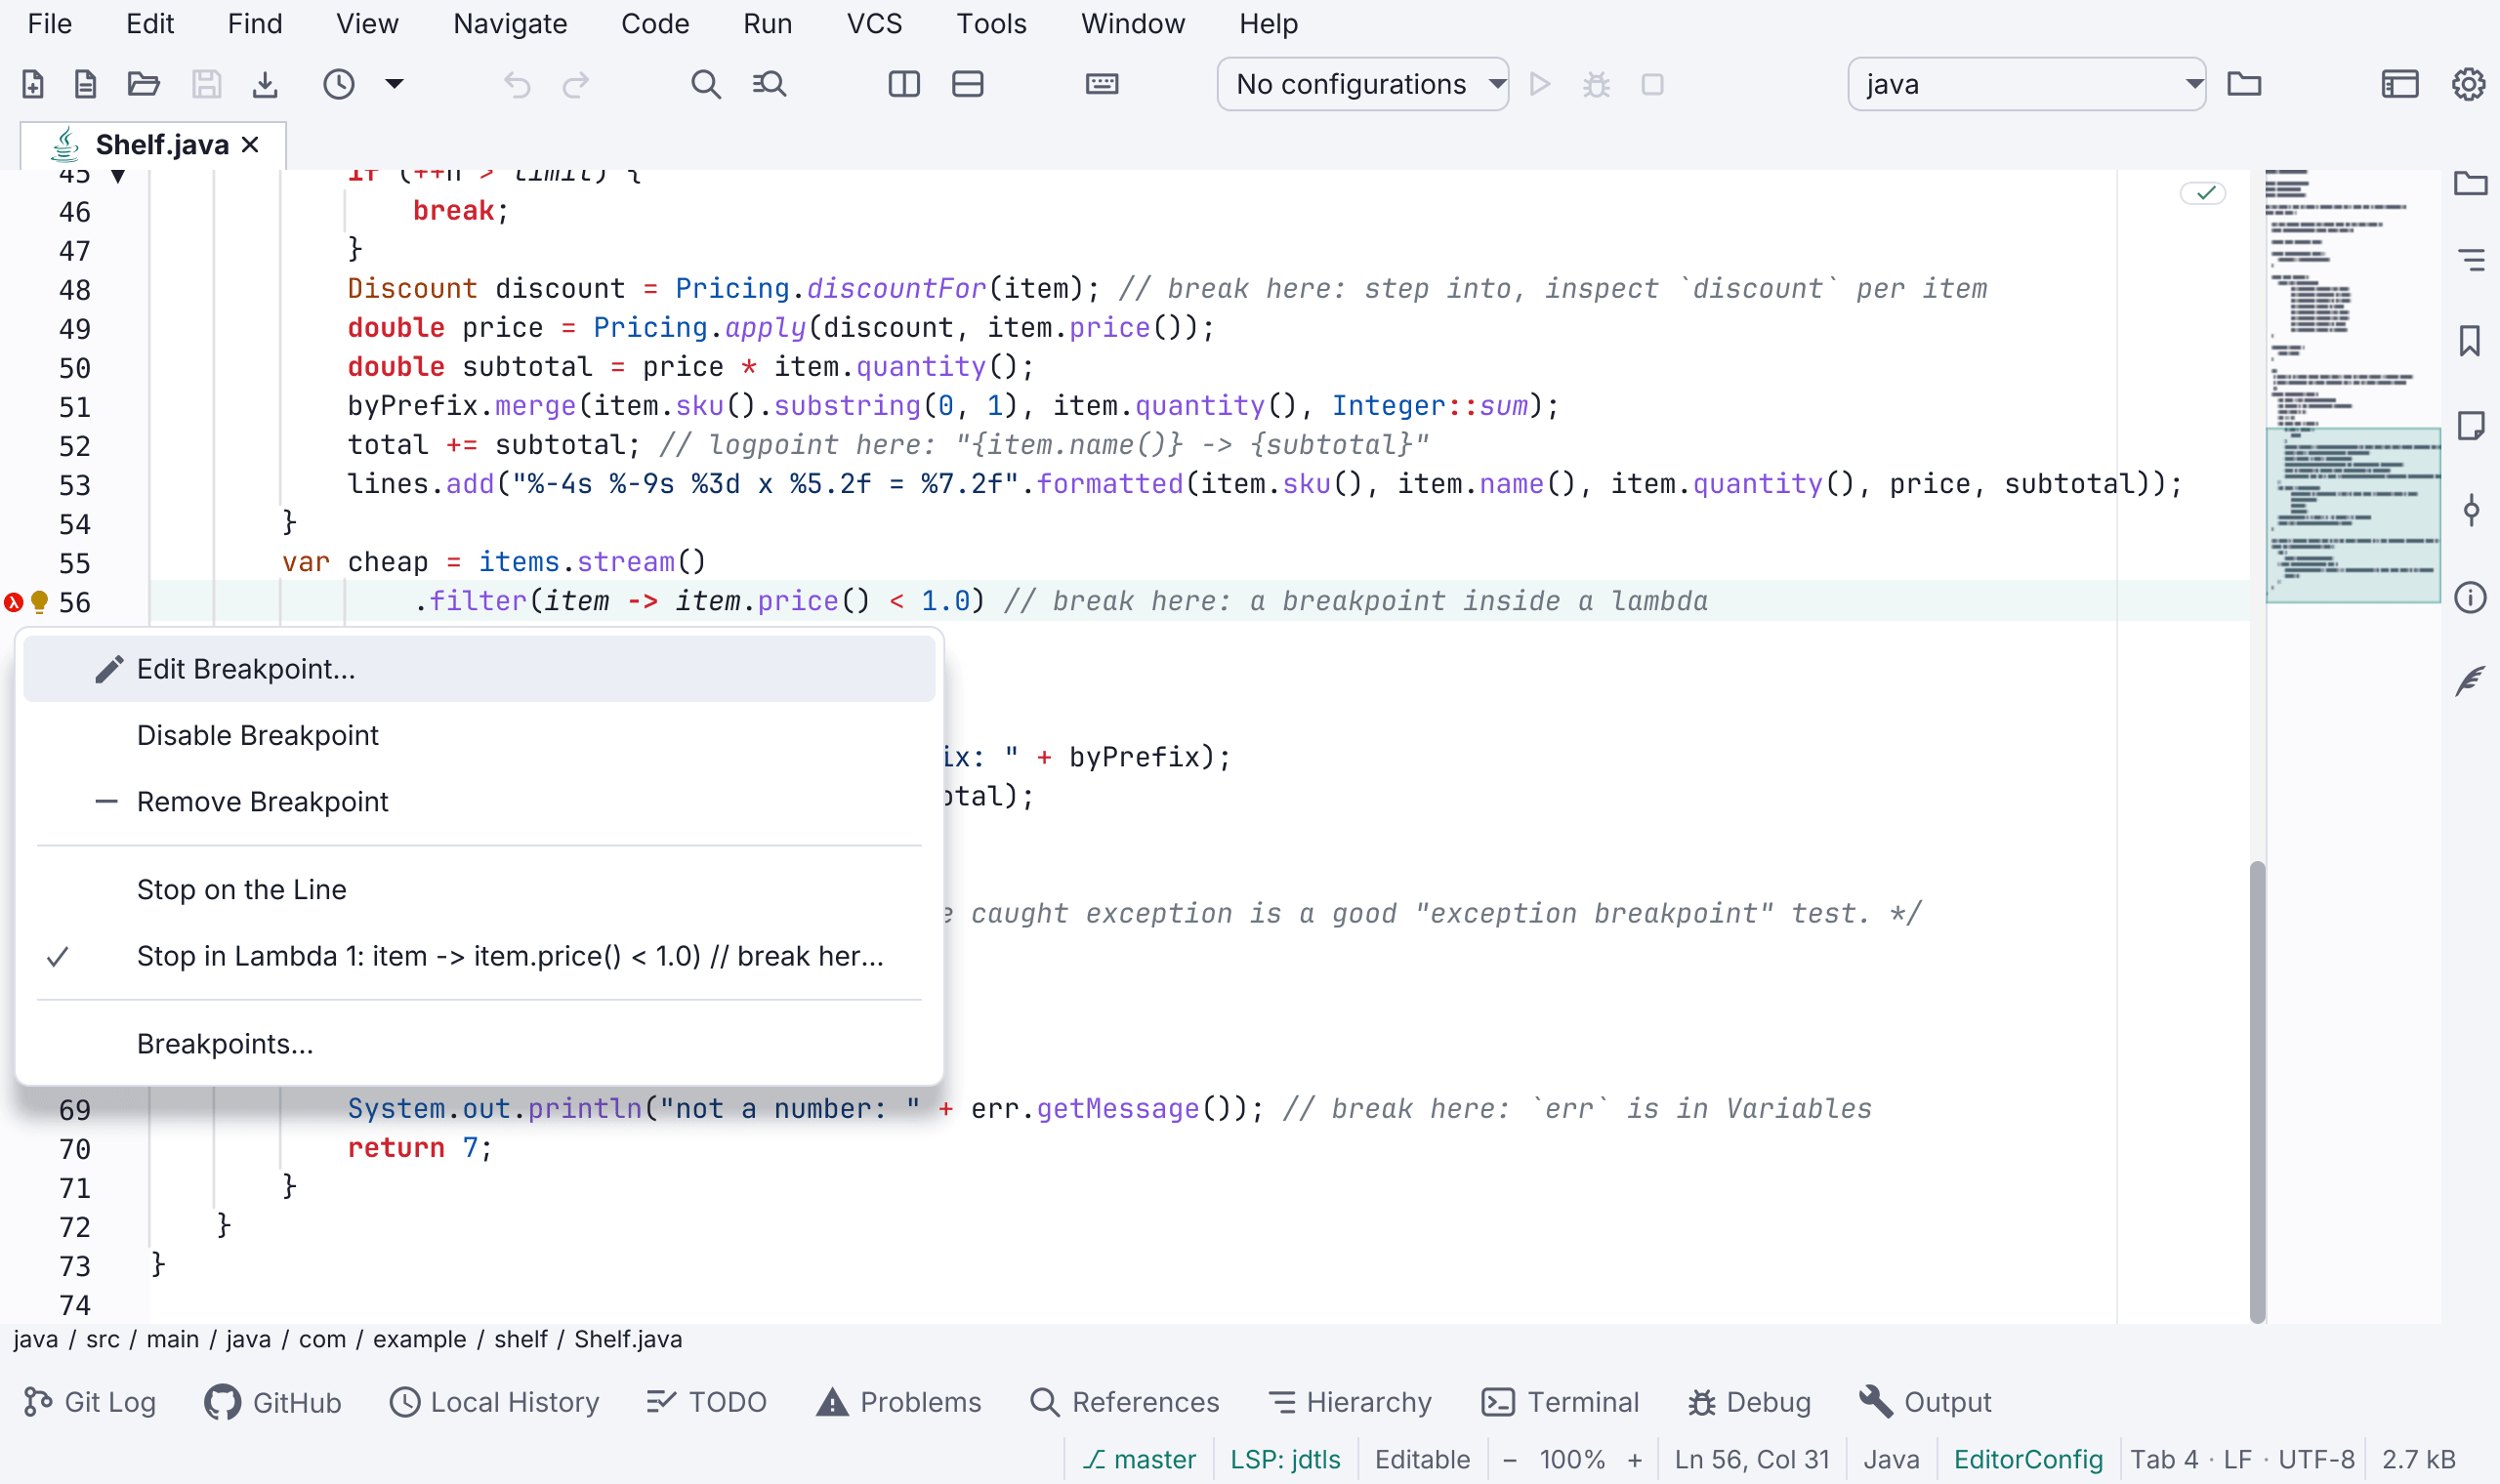
Such a breakpoint carries a λ on its dot, and its hover says Also stops in lambda 1 or Stops only in lambda 1. It keeps its condition, hit count and log message for every place it stops, and is saved with the project’s breakpoints. Lambdas are kept by their number on the line, so editing earlier in the line doesn’t lose them; when the line no longer has that lambda, the breakpoint stops on the line instead.
In JavaScript and TypeScript, the lambdas of a line are its arrow functions
(async ones and those with a TypeScript return type, such as
async (id): Promise<Item> => …, included) and the function expressions
that don’t begin the line, such as a callback passed as
function (item) { … }. A function declaration that begins its line needs no
lambda breakpoint: a line breakpoint there already stops in it. Arrows inside
strings, template literals and comments don’t count. The breakpoint stops where
the function’s body starts: the expression after =>, or the first statement
inside its braces.
Java, JavaScript and TypeScript have lambda breakpoints. The other JVM languages and the other debuggers use line breakpoints.
Method breakpoints and field watchpoints
In Java, a breakpoint can be on a method or a field instead of a line.
Debug: Toggle Method Breakpoint (debug.toggleMethodBreakpoint,
C-c C-d S-m) stops the program when the method the caret is in is entered,
before its body runs. It covers every overload of that name in that class, but
not the method in a subclass. Debug: Toggle Field Watchpoint
(debug.toggleFieldWatchpoint, C-c C-d S-w) stops the program when the
field declared on the caret line is assigned, in any instance of the class.
Run either again on the same method or field to remove it; the status bar says
what was added or removed. Both are in Run ▸ Breakpoints. The IntelliJ IDEA
keymap has no keys for them.
Away from a method or field, they ask for one by name: the class, #, and the
member, such as com.example.Order#total or com.example.Order#count. The
prompt starts with the caret’s class filled in. A nested class is written with
$, as in com.example.Order$Line#price. com.example.Order::total and
com.example.Order.total() are read the same way.
While the program is paused, Break When Value Changes in the Variables
tree’s right-click menu (debug.watchSelectedField) sets a field watchpoint on the field a row shows, such
as a field of this or of an object you unfolded. A local variable can’t be
watched, and the status bar says so.
Method breakpoints and field watchpoints are saved per project with the line breakpoints, and every Java session gets them. Debug: Breakpoints… lists them after the line breakpoints, as Method breakpoint or Field watchpoint, stops on assignment. There Alt+E enables or disables one, Alt+D removes it, and Enter opens the method or field, found through the Java language server. Mute Breakpoints mutes them with the others, and Force Run to Cursor runs past them. When one stops the program, the Debug window’s state line says Suspended on entering a method or Suspended on a field access.
Each one is marked in the gutter on its member’s declaration line, in an open
Java file: a dot with an arrow into it for a method breakpoint, on the line of
every overload it stops in, and a dot with an eye for a field watchpoint. A
mark is gold when the breakpoint has a condition or a hit count, grey when it
is disabled, and faded while breakpoints are muted. Hover it to see what it is,
such as the method’s name and Method breakpoint; click it to remove it.
Right-click it for Disable Breakpoint or Enable Breakpoint,
Remove Method Breakpoint or Remove Field Watchpoint, and
Breakpoints…. From the keyboard, Debug: Enable or Disable Method
Breakpoints on Line (debug.toggleMarkedMembersEnabled) and Debug: Remove
Method Breakpoints on Line (debug.removeMarkedMembers) act on the marks of
the caret’s line. The mark follows its member as you edit. When a line has a
line breakpoint too, the gutter shows the line breakpoint, and a click on an
unmarked line still sets a line breakpoint.
The marks are placed from the Java language server’s outline of the file, so without it there are none; the breakpoints still stop the program. Only the Java debugger has method breakpoints and field watchpoints.
Inspecting values
The line the program is stopped on is amber, with an arrow in the gutter, and
it is scrolled into view below any sticky header. Inline values appear only on
the lines up to the stopped line. Hovering a name shows its value once the
mouse rests; names in comments and strings are skipped. Debug: Show Value at
Caret (C-c C-d v) does the same from the keyboard.
A plain value, such as a number, shows on one line. An object, array or
collection shows as a tree that opens with its first level unfolded; unfold a
row to see its fields or elements. A Java String shows its whole text,
wrapped, under a line that gives its length, with a Copy Value button. A
big array comes a page at a time: its last row is “Show N more…”. Right-click a
row for Copy Value, Add to Watches and Pin to Line, which
pins its expression to the line the popup opened for; a
one-line value’s menu has Copy Value and Pin to Line. The popup closes with Esc or when the mouse leaves it. When you open
it with Show Value at Caret, the keyboard works it while it is open:
| Key | Action |
|---|---|
| Up / Down | Move between rows |
| Right | Unfold the row |
| Left | Fold the row, or move to its parent |
| Enter | Unfold or fold the row, or load the next page on “Show N more…” |
| Shift+Enter | Add the row’s expression to Watches |
| Ctrl+C (⌘C on macOS) | Copy the row’s value |
| Esc | Close the popup |
Any other key closes the popup and does its usual thing in the editor. When the popup was opened by the mouse, any key closes it.
After a step or any other stop, a value in Variables or Watches that changed since the previous stop is highlighted: its row is tinted and the value is bold, keeping its colours. Each frame is compared with what that same frame showed at the previous stop, so after you step out of a call, the caller’s variables are compared with what they were before the call. A variable that was not there before, such as one just declared, is not highlighted, and a new session starts with nothing to compare. Choosing another frame and coming back, or setting a value, keeps the highlights of the current stop.
In the Variables tree, the right-click menu has Copy Value (a string is
copied without its quotes and escapes), Copy Name, Copy as Expression,
Add to Watches, which adds the row’s whole expression, such as
order.items, Set Value…, Jump to Type Source,
Go to Index… on a long list or array, in Java
Break When Value Changes on a
field, Mark Object… on an object,
View As on a string, and Show
Numbers as Hexadecimal. Ctrl+C (⌘C on macOS) copies the selected value, and Delete removes the selected
watch or evaluate result.
Copy as Expression copies what gives the value in the stopped code, as the
debugger itself names it: items.get(0) in Java or d['k'] in Python, rather
than items[0]. Add to Watches, Set Value and View As use the same
expression. Jump to Type Source opens the class the value really has, which
may be a subclass of the variable’s type, in your code or the JDK’s; it is
offered where the file’s language server can find a type by name.
Each of these rows is also a command that acts on the selected row, so it can
be given a key under Settings → Keymaps: Debug: Copy Selected Value
(debug.copySelectedValue), Debug: Copy Selected Name
(debug.copySelectedName), Debug: Copy Selected Variable as Expression
(debug.copySelectedExpression), Debug: Add Selected to Watches…
(debug.watchSelected) and Debug: Jump to Type Source of Selected Value
(debug.jumpToSelectedType); the other rows’ commands are named in their
sections below.
In Java, Set Value… sets a number, boolean, character or String directly,
and an Integer, a record or an enum variable by assigning what you type as an
expression, such as Color.RED.
In Java, an object whose class has its own toString(), such as a record, an
enum or a date, shows that text after its type, for example
Main$Point@17 "Point[x=3, y=4]", and still unfolds to its fields. A boxed
number, such as an Integer, shows just its value: 42. A lambda reads
lambda@19. Variables, watches, inline values and the hover popup all show
values this way. A Variables row shows at most 200 characters of a value; Show
Value and Copy Value give the whole text.
Each toString() is your program’s own code, run once per object at each stop,
so a stop gives them 1.5 seconds in all. A row whose toString() has not
answered by then reads (toString() not loaded yet: click to load), and loads
when you click it, press Enter on it or unfold it. After Pause, objects read
Type@id with (toString() not available after Pause). While a toString()
has not returned, the debugger takes no other request, and the status bar says
so: wait, or press Stop. Show toString() values on the Java card of
Settings → Debugging (on by default) turns these calls off: objects then
read Type@id, from the next debug session.
While the program is paused, completion works in the
evaluate field over Variables, the
Evaluate window, the Debug console’s input field, the
Add Watch and Edit Watch prompts, and a breakpoint’s condition and log message.
Press Ctrl+Space, or type ., to list what the debugger can complete in the
stopped frame. Keep typing to narrow the list, use Up and Down to move in it,
Enter or Tab to insert the selected item, and Esc to close it. In a field that
evaluates, Enter inserts the item and does not evaluate yet. In a log message, only the {expression} part at the caret is completed.
When the program is not paused, Ctrl+Space says under the field that
completion needs a pause. A breakpoint’s condition is completed against the
frame the program is stopped in, not the breakpoint’s own line.
Emoji and other characters outside the Basic Multilingual Plane show as
written in Java string values: in Variables, watches, the hover popup and
inline values. One limit remains, from a bug in the Java language server’s
debugger: a string that an evaluation builds, such as name + "!", and the
text inside a toString() result can still show such characters garbled.
The thread list leaves out the JVM’s own housekeeping threads and puts the stopped thread first, marked “(paused)”. The Threads view shows every thread at once. After the program ends, the state line keeps “Exited with code N”.
Copy Call Stack, in the call stack’s right-click menu, copies the shown thread’s whole stack as text, ready to paste into a bug report or a chat. Ctrl+C (⌘C on macOS) in the call stack does the same. Frames folded into one row are copied too. The text reads like a Java stack trace: the thread’s name, then one line per frame, top frame first:
Thread "main"
    at Main.total(Main.java:12)
    at Main.main(Main.java:5)
A frame without a source file is copied with its name only.
Evaluating expressions
While the program is paused, an expression can be evaluated in the frame
selected in the call stack, as in IntelliJ IDEA: in the field at the top of
Variables, in an Evaluate window, or with Alt+click in the editor. An
expression may call a method, such as items.add(7), and the call runs in
your program. After an evaluation, Variables, watches and inline values are
fetched again, so an assignment such as count = 5 shows at once. An
expression that throws says what it threw, such as The expression threw
NullPointerException in length().
Expressions are evaluated only at a stop. While you look at an earlier stop in Debug History, the fields say to go back to the live stop first. A step pressed while an evaluation runs is refused, and the status bar says why.
The evaluate field in Variables
The Debug window’s Variables start with an evaluate field. Type an expression
and press Enter: its result is the first row of the tree, and an object, list
or map opens under it, a row per field or element. Those rows work like any
other Variables row, with Set Value…, Copy Value, Copy Name and
Add to Watches in their right-click menu. The result stays until the
program moves on; Clear Result, in the result row’s menu, or Delete on it,
removes it sooner (debug.clearResult).
The button beside the field adds the expression to Watches, so you
can follow it at every stop (debug.watchEvaluated). Debug: Focus Evaluate Field
(debug.focusEvaluate) puts the keyboard in the field from anywhere.
The Evaluate window
Debug: Evaluate Expression (debug.evaluate: Alt+F8 in the IntelliJ IDEA
keymap, C-c C-d x in Emacs, and in the editor’s right-click menu while the
program is paused) opens an Evaluate window. It opens with the selection,
or the expression at the caret, ready to evaluate or to type over. The window
is not modal: keep it beside the editor while you step, or open several at
once, each with its own expression.
Enter, or the Evaluate button, shows the result below as a tree, which
opens like the one in Variables, with Copy Value, Copy Name and Add to Watches
on its rows. A failure shows the debugger’s reason in its place. The line
beside the buttons, Evaluates in …, names the frame the window evaluates in,
with its line and file. While the program runs, the line says it is not paused and Evaluate is
greyed out. Add to Watches adds the expression to Watches, and the
History button beside the field (debug.evaluateHistory) lists your last expressions; pick one to put it
back in the field. Esc or Close closes the window. After the program moves
on, the last result can still be read but not unfolded; evaluate again for the
new stop.
Before, Debug: Evaluate Expression went to the Debug console’s input field; use Focus Evaluate Field for a field in the Debug window.
Typing an expression
The evaluate field and the Evaluate window’s field are small code editors:
- They are highlighted in the language the program is stopped in.
- They take your keymap’s motion and editing keys. In the Emacs keymap
that is
C-aandC-e,M-fandM-b,C-d,C-k,M-d,M-DEL,C-w,M-wandC-y, andC-/to undo. - Completion lists what the debugger can complete: press Ctrl+Space, or
type
.(see completion). - They share one history, kept between sessions. Up and Down bring back
the expressions you evaluated before; in Emacs,
C-pandC-ndo too at the first and last line, and so doM-pandM-n. - Shift+Enter, or the expand button beside the field, turns it into a code fragment of several lines, where Enter starts a new line and Ctrl+Enter evaluates.
Java and JavaScript give a fragment’s value: int x = 2; return x * 3; in
Java, or let x = 2; x * 3 in JavaScript, shows 6. Python runs a fragment but
shows no value; evaluate an expression on its own to see one.
Quick Evaluate
While the program is paused, Alt+click an expression in the editor to
evaluate it at once. Clicking a name evaluates it with the names before it, as
hovering does: order.total for the total of order.total, and order
alone for order. Clicking a method’s name includes the call and its
arguments, so on get in list.get(i + 1) it runs list.get(i + 1), which
hovering never does. Alt+click inside a selection evaluates the selection
instead. The value shows in the same
popup as a hover, as a tree for an object, and an
expression that fails shows the debugger’s reason. Unlike hovering, Quick
Evaluate runs code, so a call it evaluates has its effects. Debug: Quick
Evaluate at Caret (debug.quickEvaluate) does the same from the keyboard,
for the selection or the expression at the caret.
Time limit
An expression that calls a function which never returns, in a watch, the Debug console or a hover, would hold the paused program for good. With GDB and Python’s debugger, the call is stopped after a time limit: the program stays paused on the same line, and the next expression is evaluated there. Set it with Time limit under Evaluating expressions in Settings → Debugging: 10 s by default, or 5 s, 30 s, 60 s, 300 s, or Each debugger’s own. It applies from the next session on.
CodeLLDB stops such a call in a watch or a hover by itself. The Java, JavaScript and Go debuggers have no limit to set: after 30 seconds Editora stops waiting and says the program is still running the expression.
Watches
A watch is an expression evaluated at every stop and listed under Watches
in Variables. Add one with Add to Watches in a Variables row’s menu, the
button beside the evaluate field, the
Evaluate window, the editor’s right-click menu while paused (Debug: Add
Expression at Caret to Watches…, debug.addWatchAtCaret), or
Debug: Add Watch (C-c C-d w). Delete, or Debug: Remove Selected Watch
(debug.removeSelectedWatch), removes the selected watch, and
Undo Last Removal puts it back in its place, paused
or not. Edit Watch… (debug.editSelectedWatch) changes its expression.
A watch row’s right-click menu has:
- Pause Watch: the watch stays listed, marked (paused), but is not
evaluated at each stop. Use it for an expression that is slow or that you
need only now and then. Resume Watch evaluates it again at every stop.
A paused watch stays paused in later sessions. Both are
debug.pauseSelectedWatch. - Evaluate Once (
debug.evaluateSelectedWatchOnce), on a paused watch while the program is paused: evaluates it for the stop shown, and it stays paused. - Set Value…, while the program is paused and the watch has a value: gives
the watch’s expression a new value, such as a variable, a field or an
element. The prompt starts with the current value, and every watch and value
shown is evaluated again afterwards. Python and JavaScript set the expression
itself; Java, Go and C and C++ set the variable the watch names, and Java
evaluates an assignment for a field such as
o.n. - Remove All Watches, also on the Watches heading: removes every watch.
Pinned values
A pinned value is an expression kept on a line and shown at the end of that line at every stop, as Visual Studio’s pinned DataTips and IntelliJ’s inline watches are, so you can follow it next to the code instead of in Watches.
Debug: Pin Value to Line (debug.pinValue, in Run ▸ Debugger) pins the
selection, or the expression at the caret, to the caret’s line. With neither,
it asks for an expression. Running it again on the same expression unpins it.
Pin to Line in the value popup’s right-click menu,
shown as Pin total to Line 12, pins the popup’s expression to the line it
opened for (debug.pinShownValue). A line holds at most four pinned values. Debug: Unpin Values on
Line (debug.unpinLine) removes every value pinned to the caret’s line. The
status bar says what was pinned or unpinned, and
Undo Last Removal puts back a value, or a line’s
values, that you unpinned.
At each stop, and when you pick another frame, every pinned value in the open files is evaluated in the selected frame and painted after the values the editor shows by itself, in the info colour:
◆ total = 3 · items.size() = 2A value is cut to 60 characters. One that can’t be evaluated there, such as a variable not in scope, shows unavailable: and the debugger’s message. The values are cleared while the program runs and when the session ends.
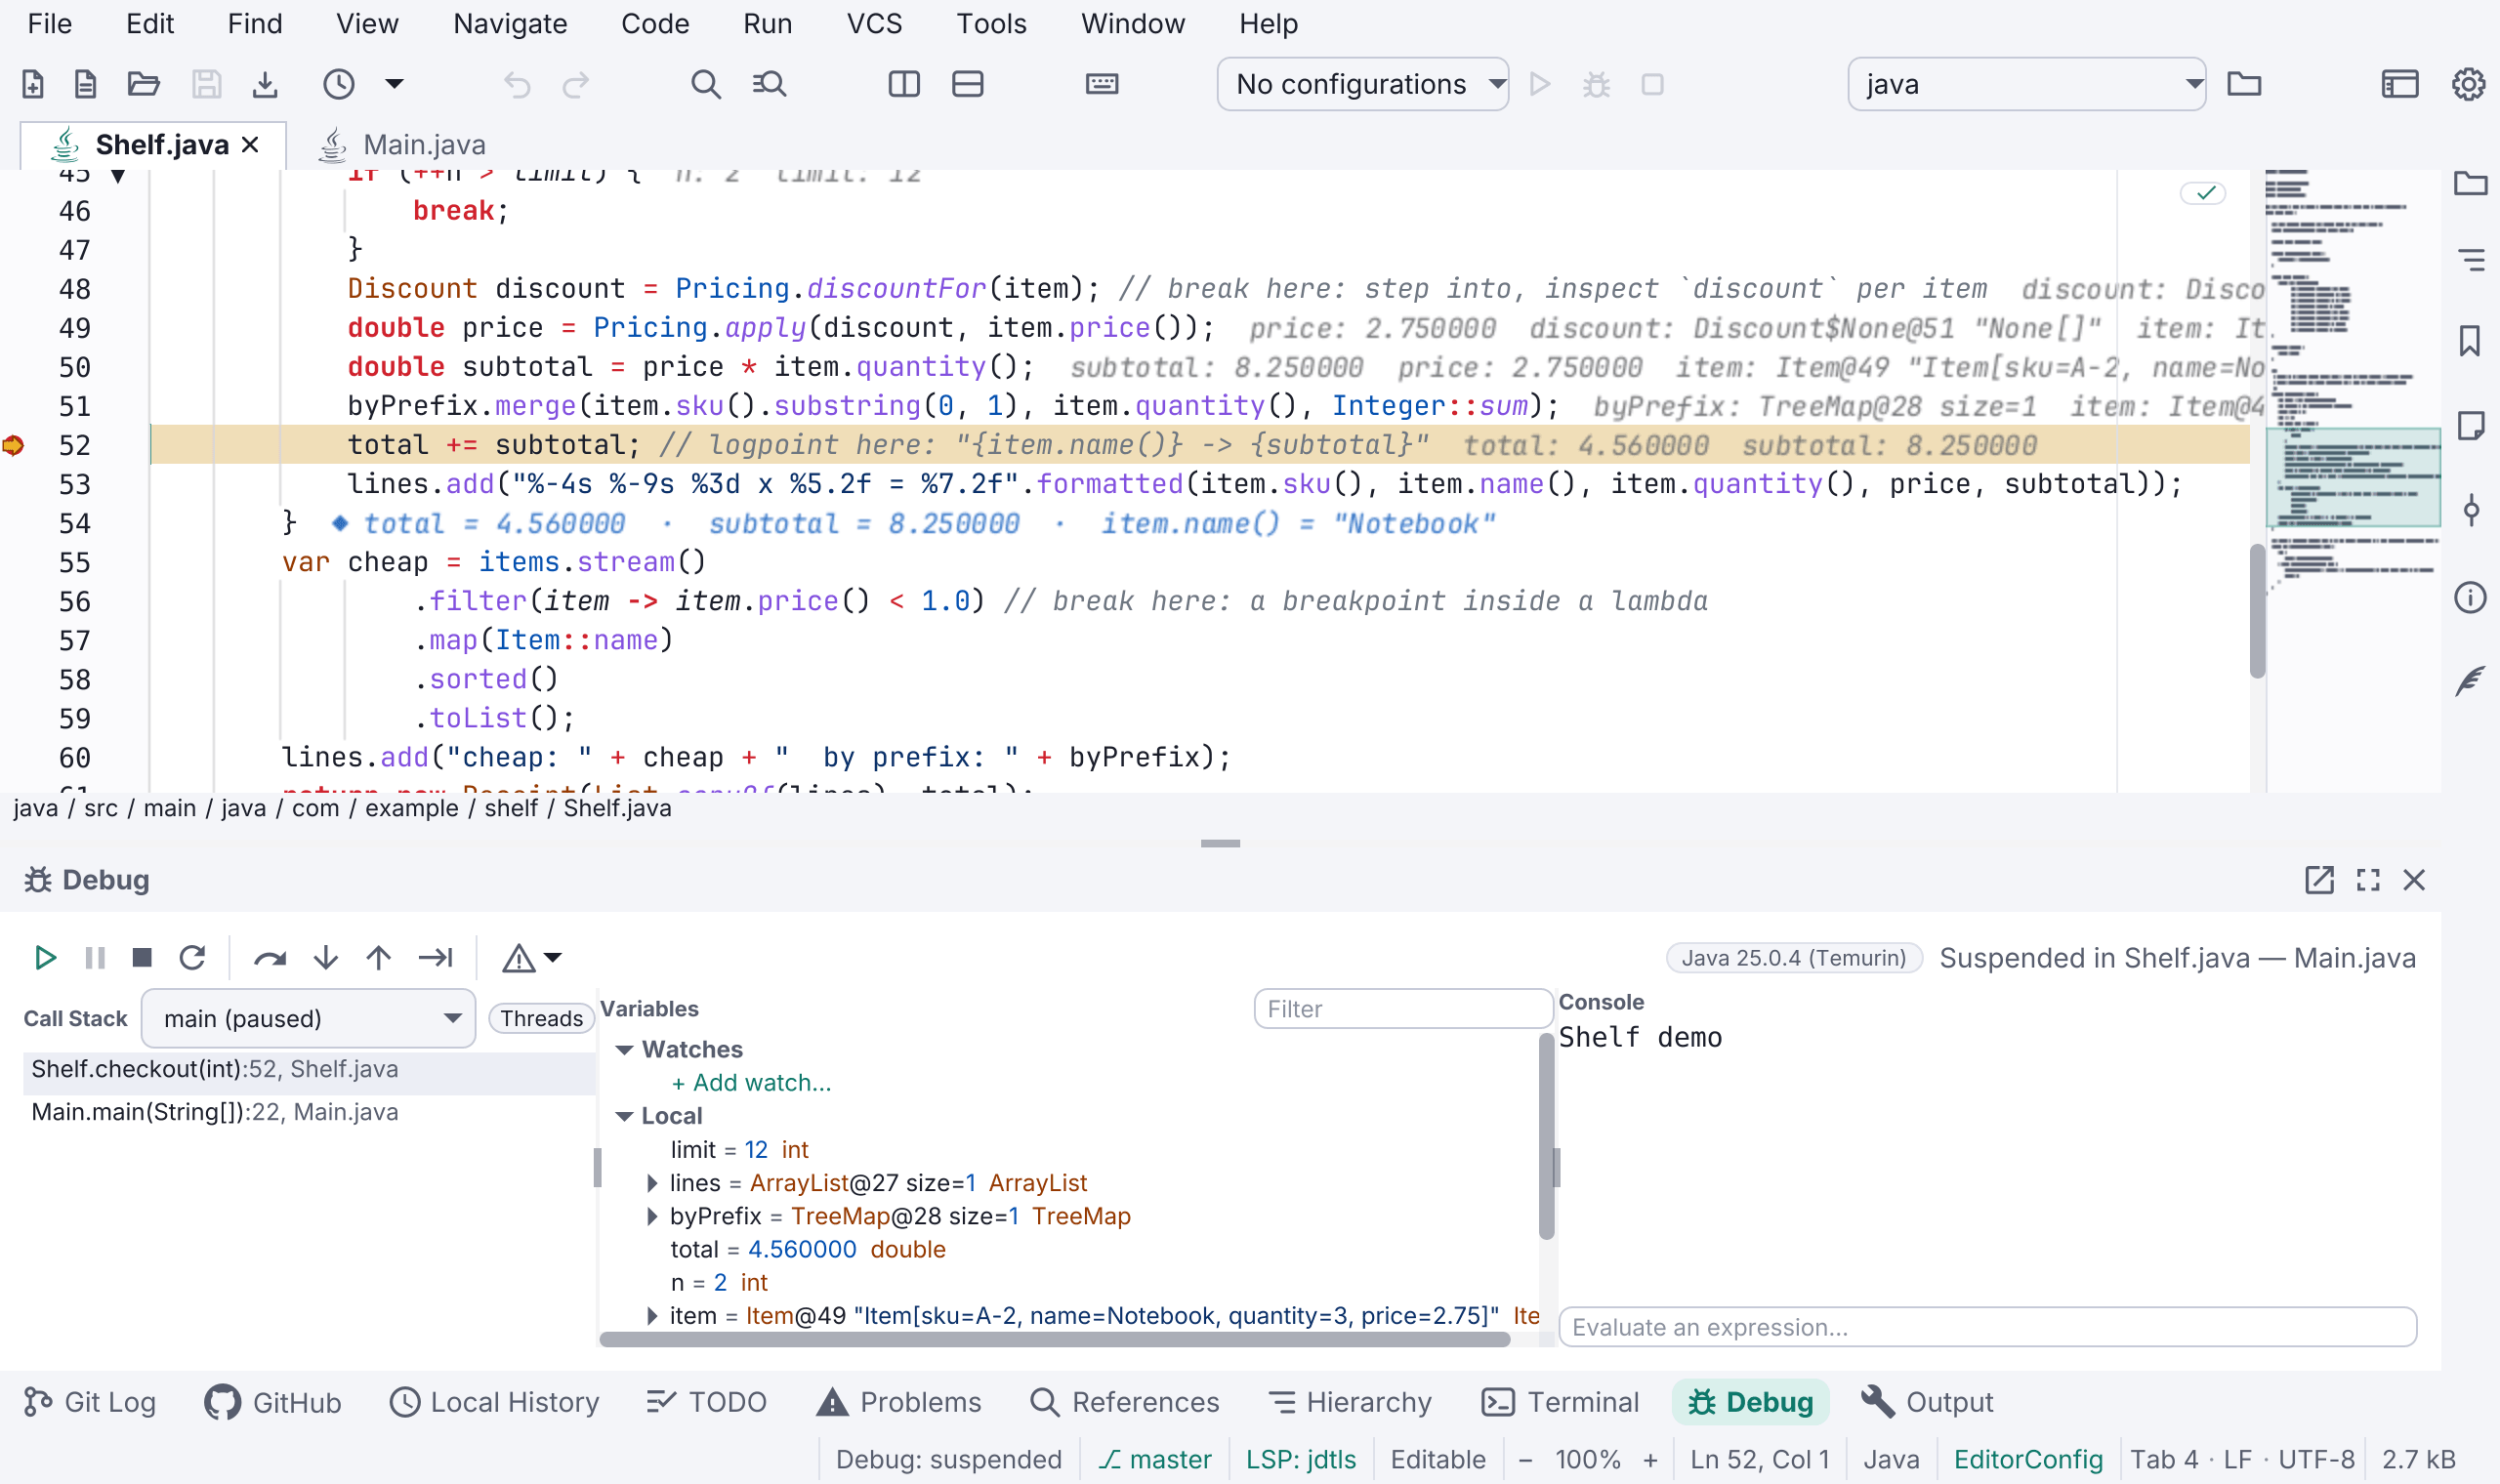
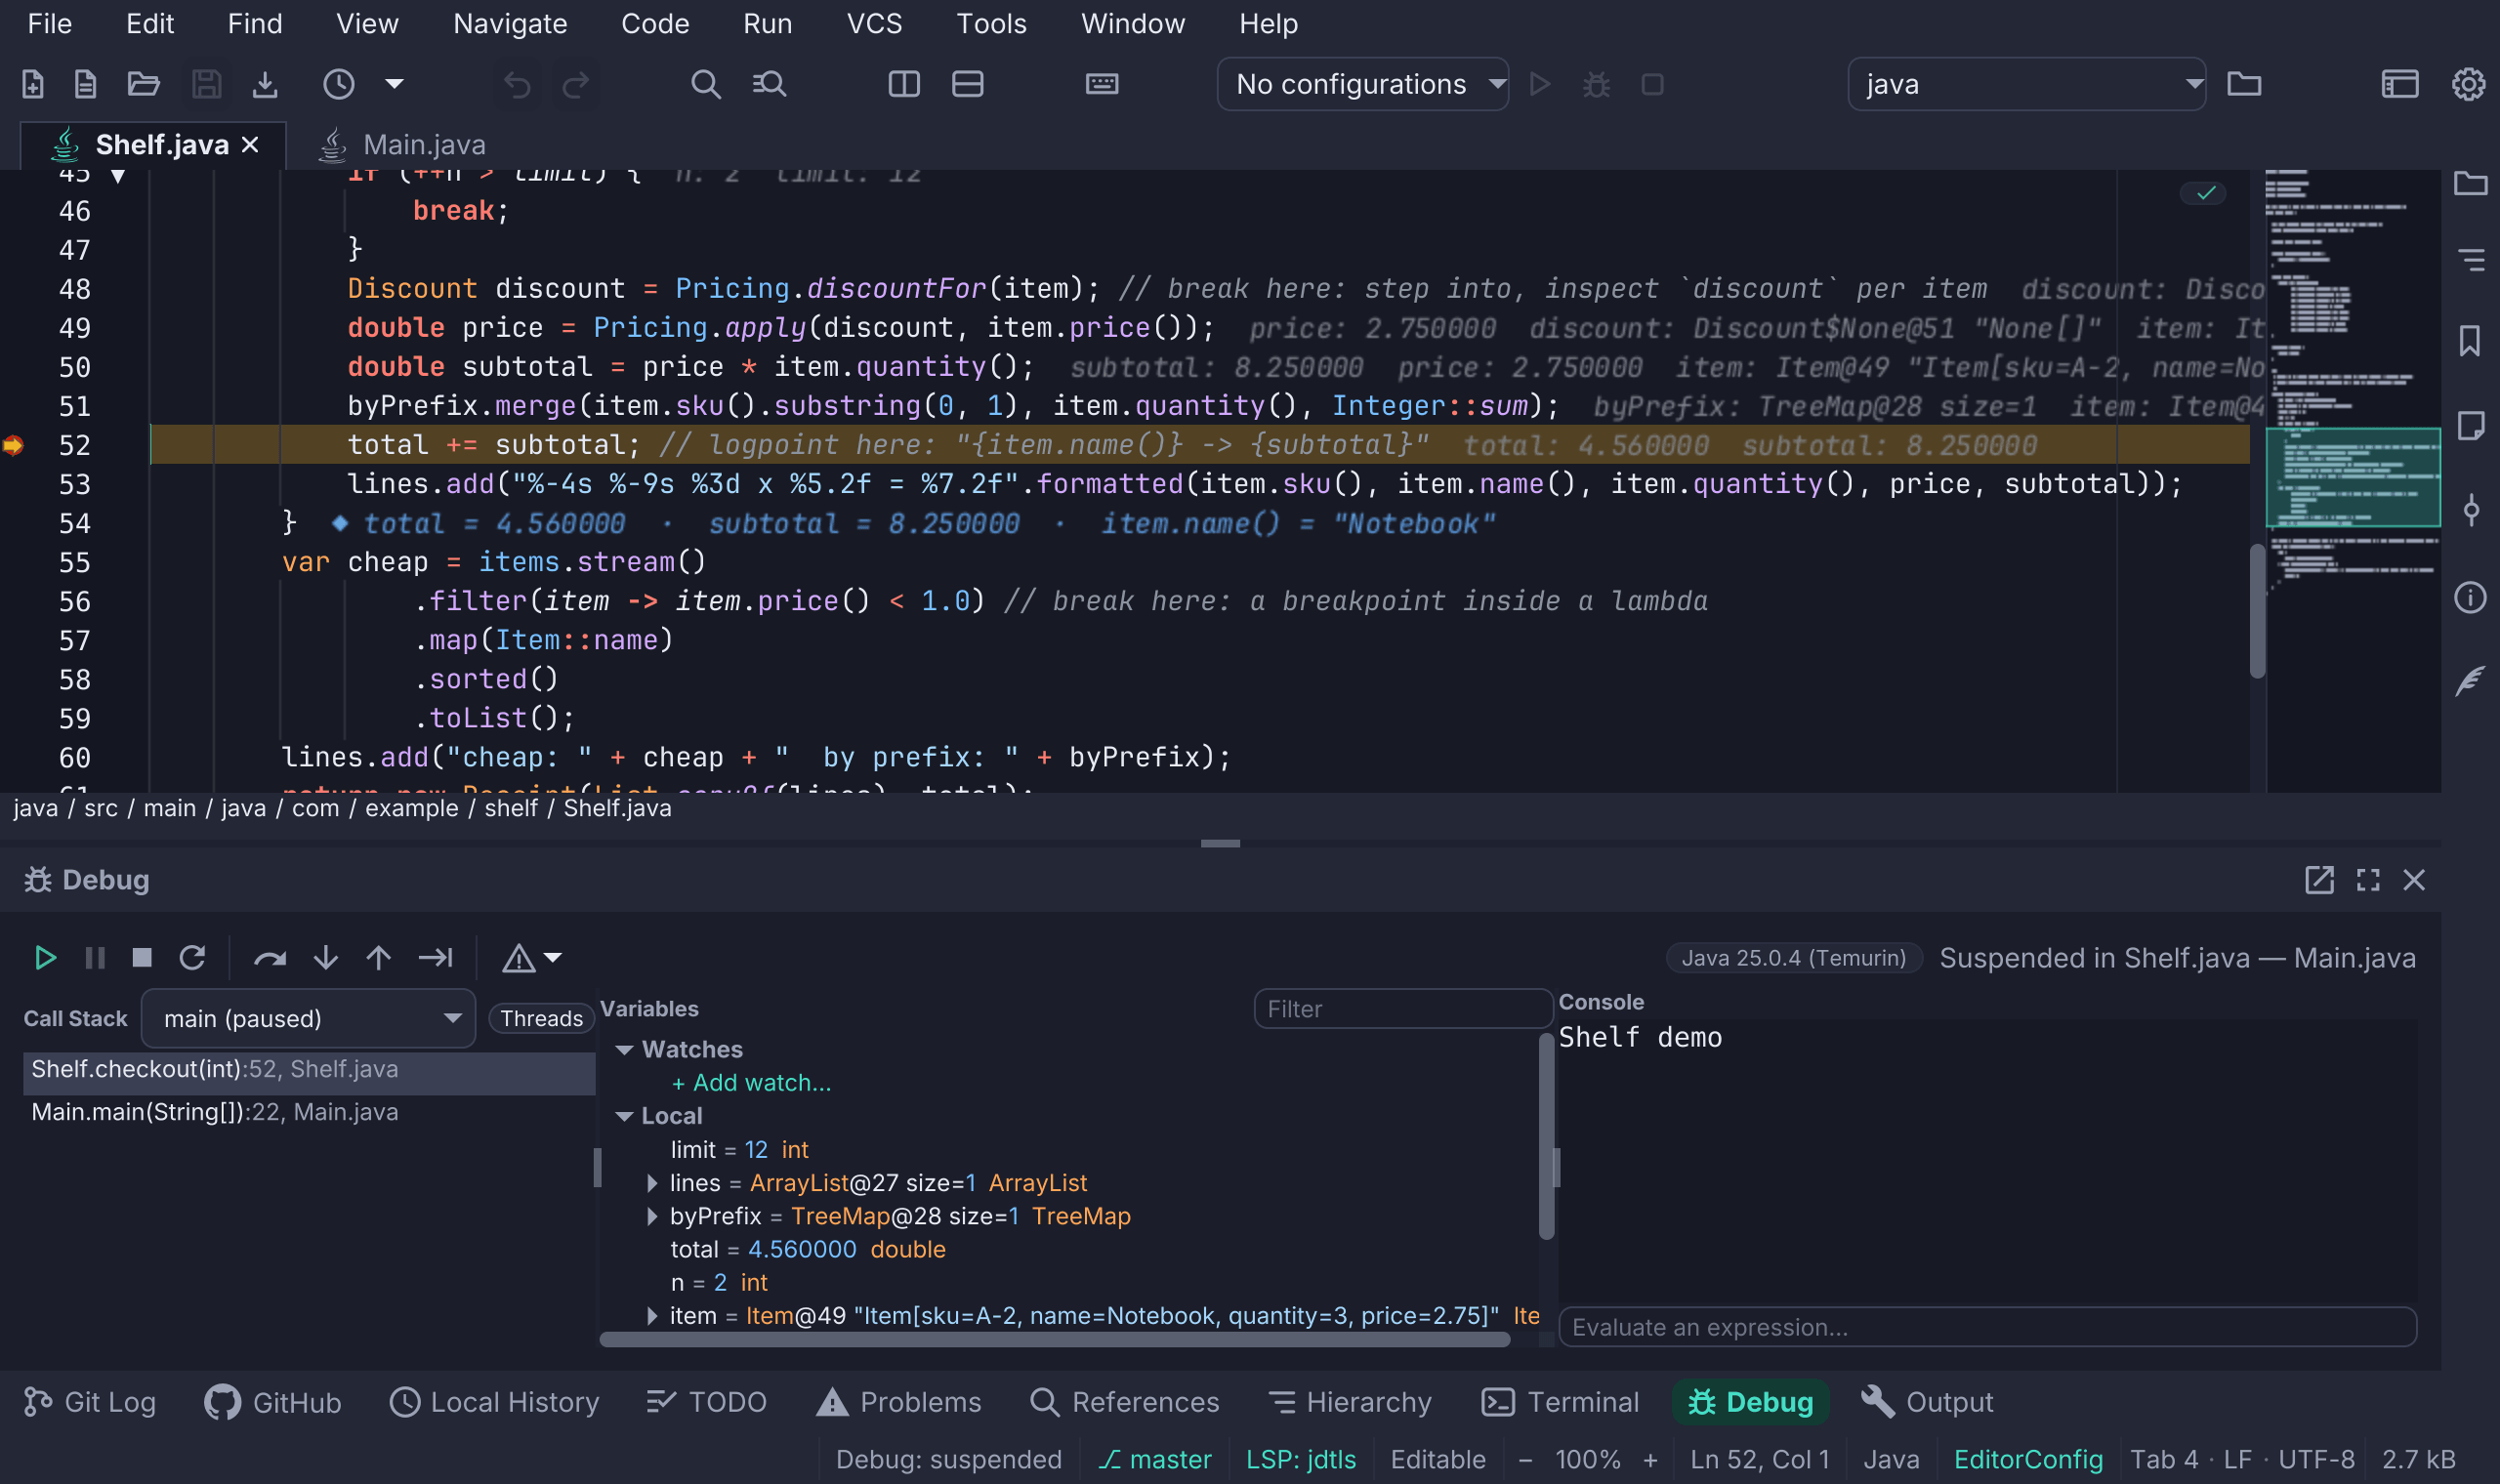
Pins are kept when no session runs, though they show only while the program is paused. They follow their line as you edit above it, are saved with the project’s breakpoints, and come back on their line when the file opens again.
Marking objects
Mark Object…, in the right-click menu of a Variables, watch or
evaluate result row that shows an object, gives
that object a label of your own, as IntelliJ IDEA’s Mark Object does. The
prompt starts with the row’s name; type another, of up to 40 characters, and
press Enter. The label then shows in brackets before the object’s value
wherever that object appears in the session: in Variables, watches, evaluate
results, the value popup and Debug History. So when the same
object turns up in another variable, a field or a collection, you can tell it
is the one you marked. On a marked row the menu has Edit Mark… and
Unmark Object, and once anything is marked, Unmark All Objects. Debug:
Mark Selected Object… (debug.markSelectedObject) and Debug: Unmark
Selected Object (debug.unmarkSelectedObject) do it for the selected row.
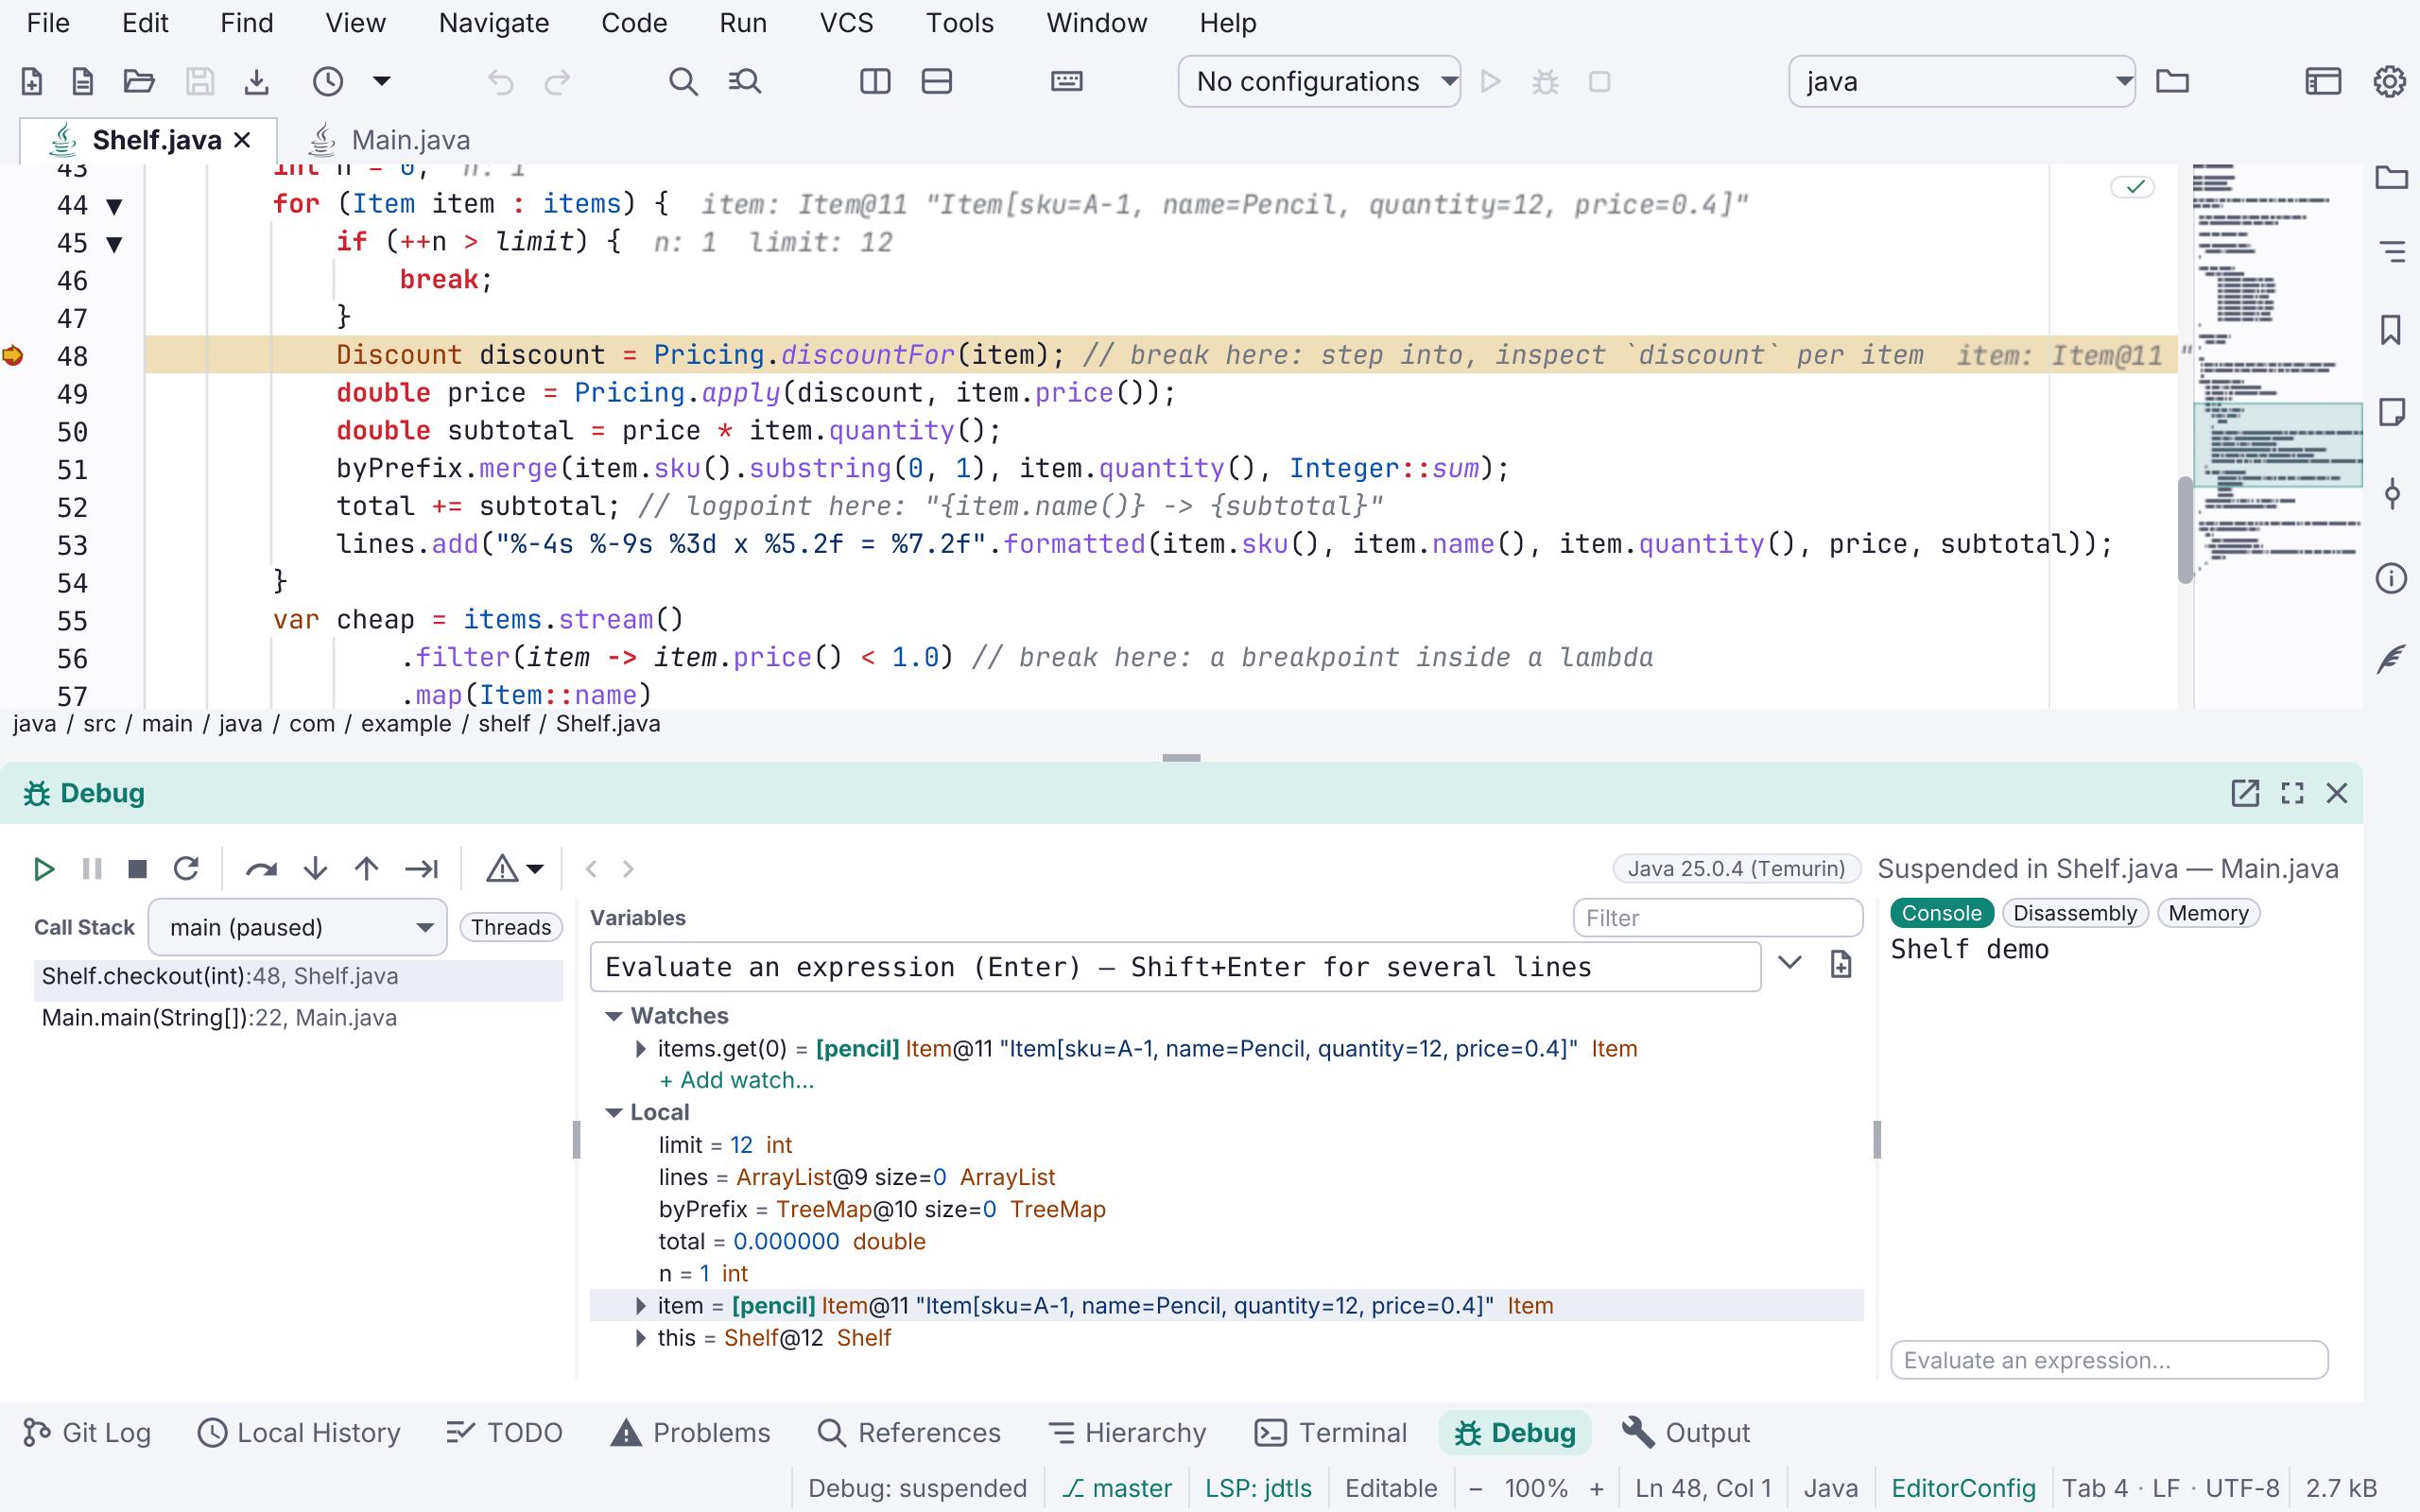
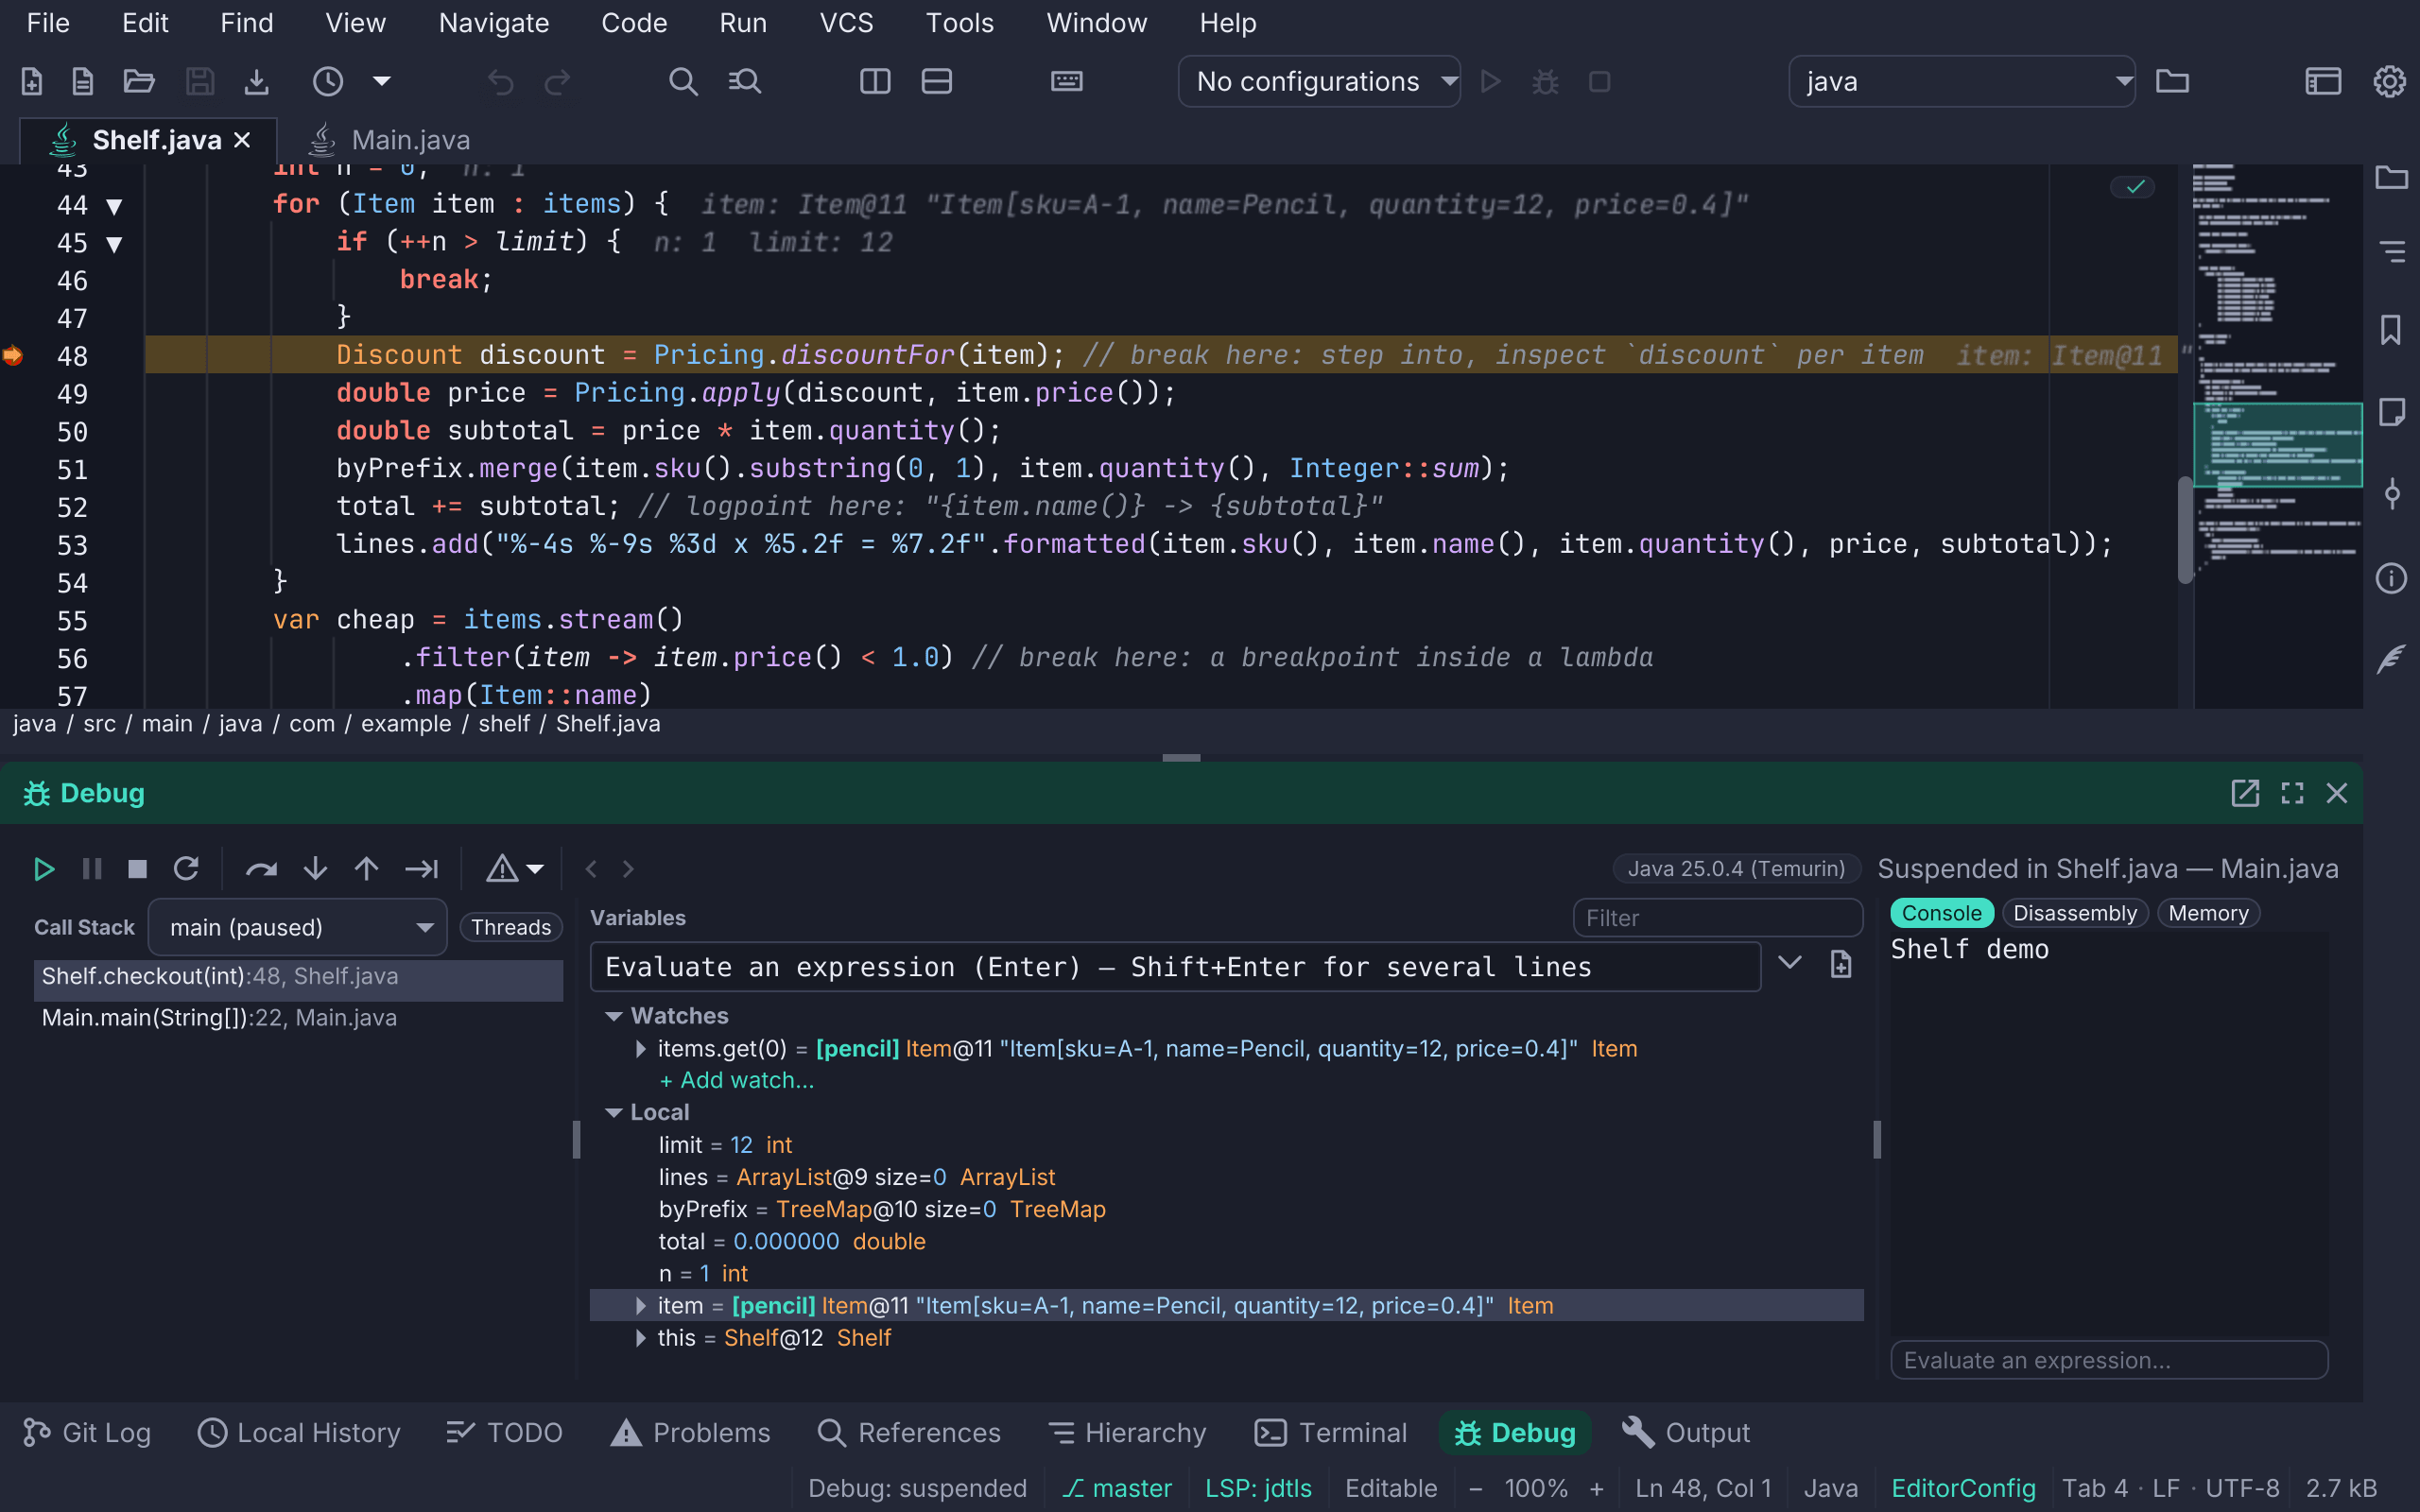
An object is recognised by the identity its debugger shows for it, so Mark
Object is offered where the debugger shows one: Java objects (Item@11),
Python objects with an address (<Box object at 0x7f…>), and pointers in
native code, such as C and C++. The JavaScript debugger shows no identity for
an object, so JavaScript and TypeScript objects can’t be marked, and neither
can a number or a string.
Marks belong to the debug session. They stay after Stop, so Debug History still shows them, and are cleared when the program is debugged again, since an object of one run is not the same object in the next. A label only shows the object; it can’t be used in an expression. IntelliJ IDEA’s Referring Objects is not offered: the Java debugger has no way to find which objects refer to another.
Viewing a string as JSON, XML or text
View As ▸ JSON, View As ▸ XML and View As ▸ Text, in the
right-click menu of a Variables, watch or evaluate result row that holds a
string, open the string’s whole text in a read-only tab, so you can fold,
search and copy it. JSON and XML are laid out and highlighted; Text opens it as
it is. The tab is named after the row, such as order (JSON). A string that
isn’t valid JSON or XML opens as text, and the status line says why, such as
Not valid JSON, so shown as text: …. The three are also
debug.viewSelectedAsJson, debug.viewSelectedAsXml and
debug.viewSelectedAsText, for the selected row.
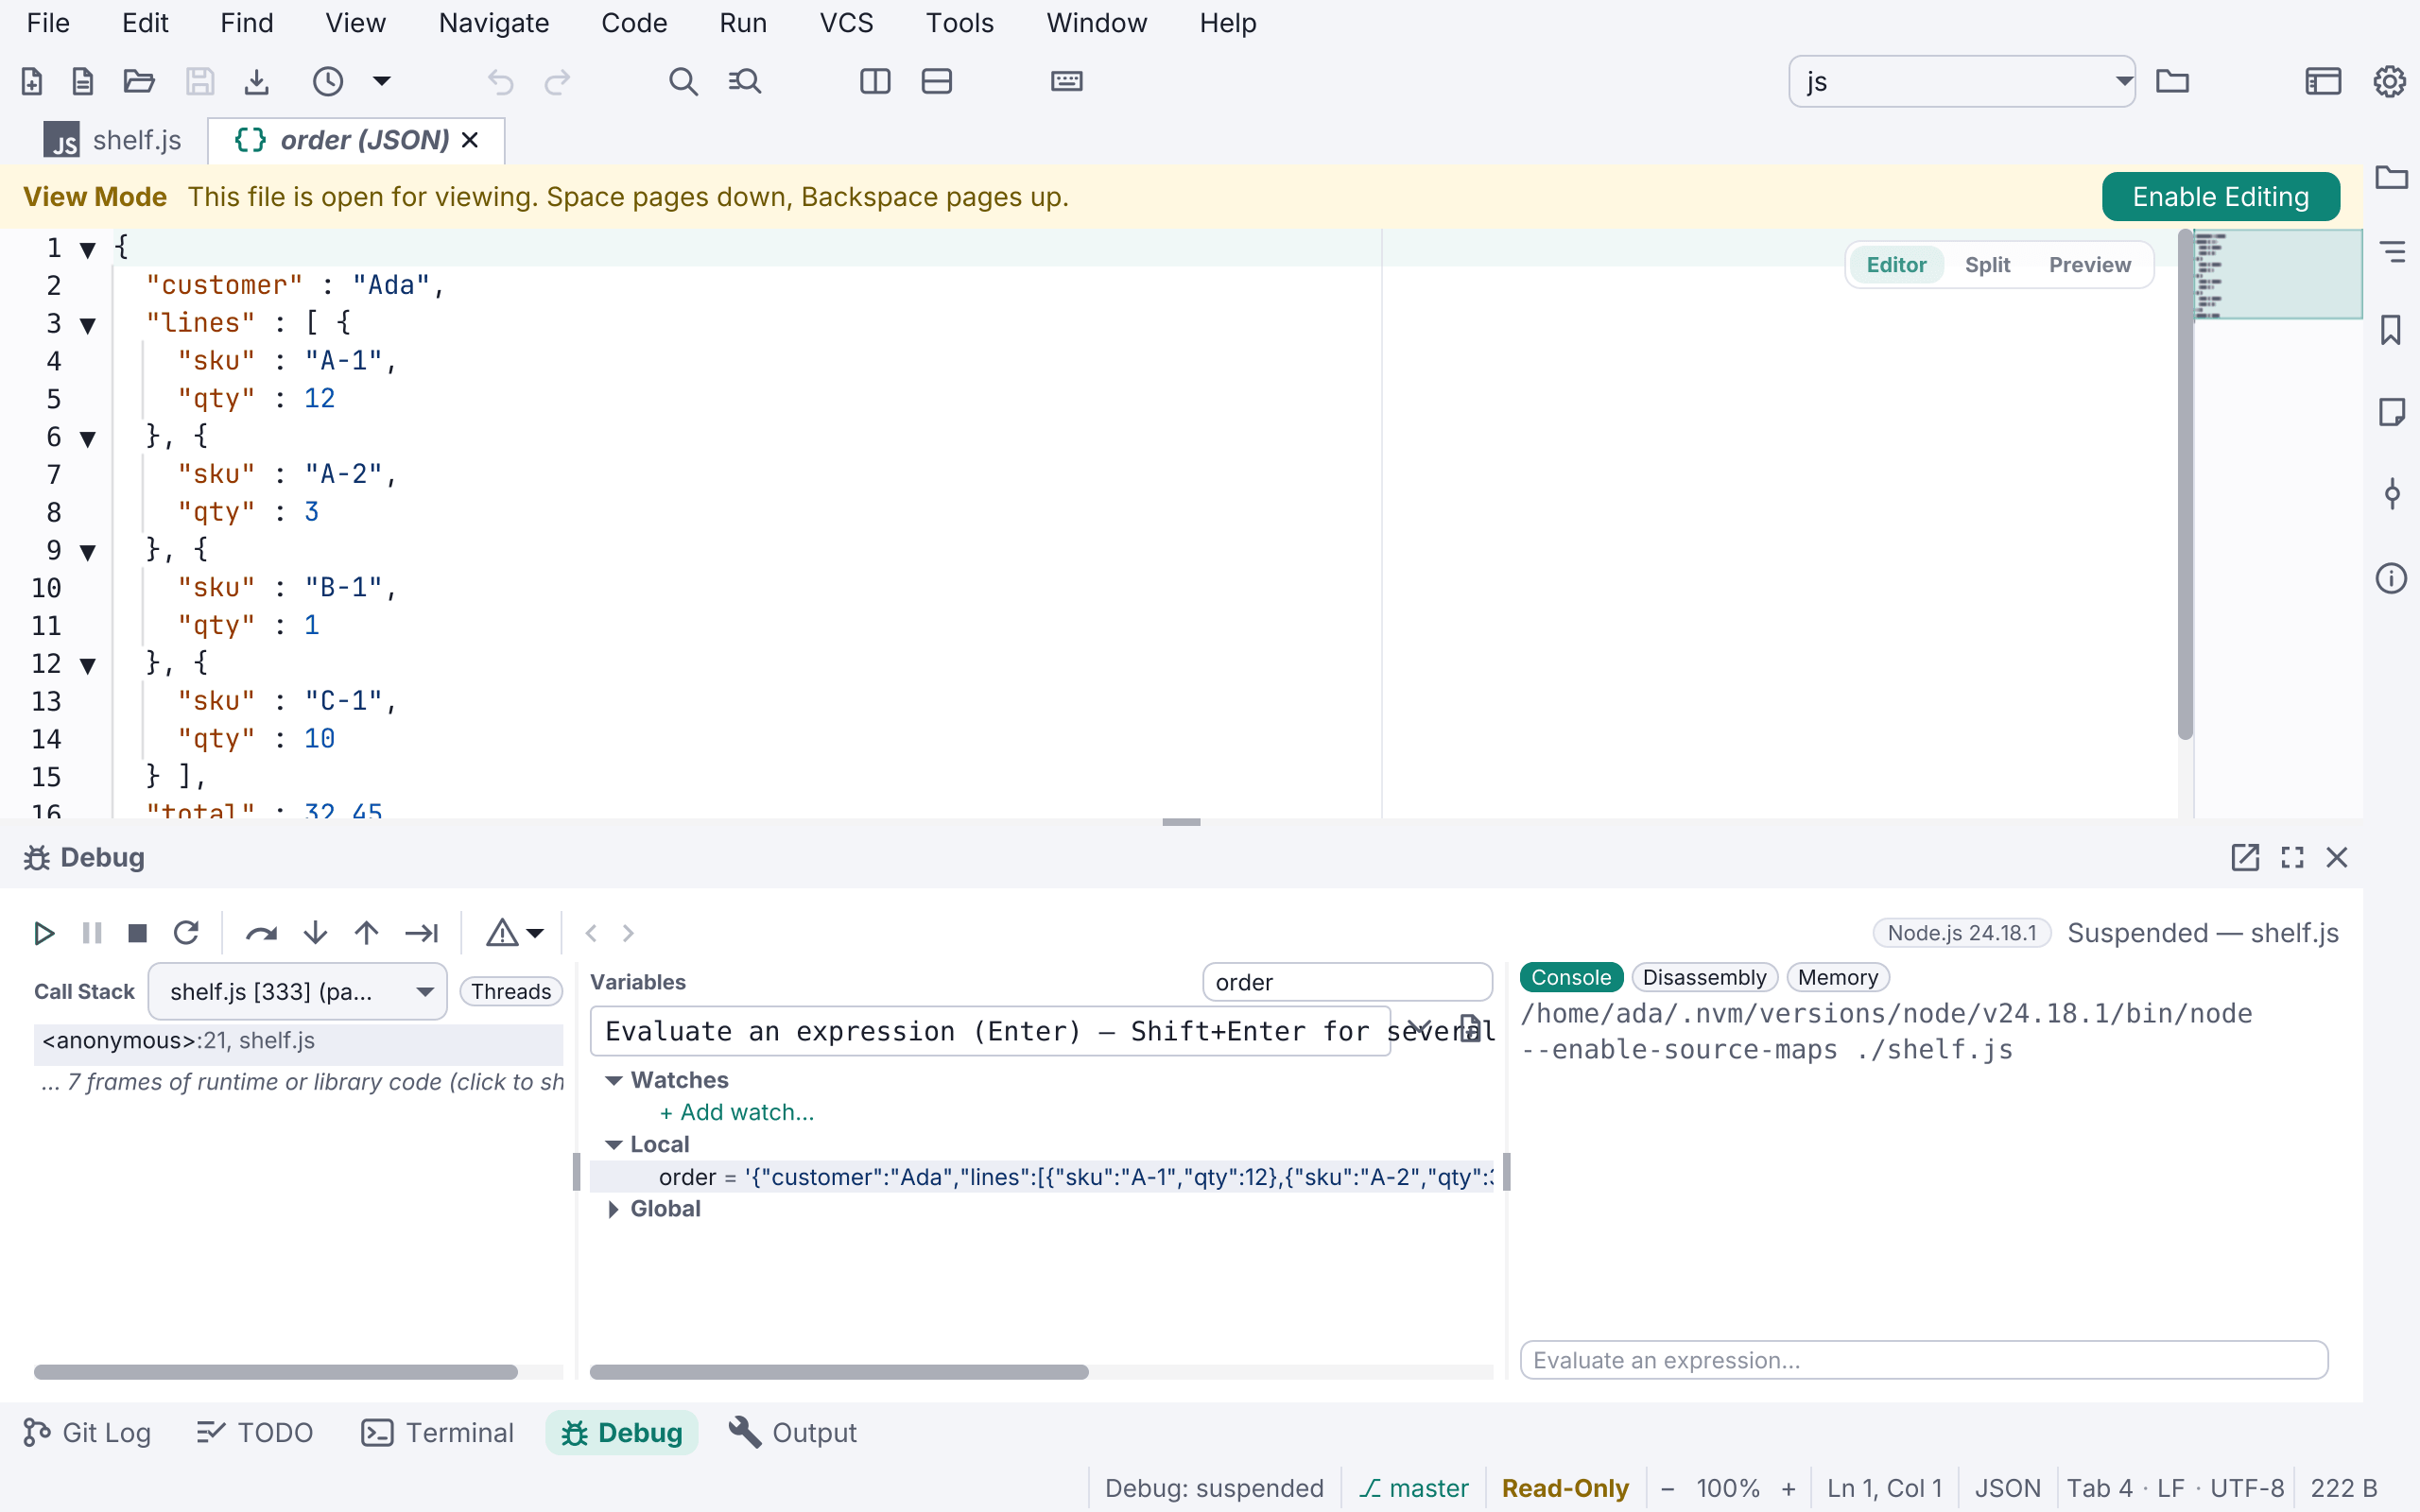
The text is the string’s own, with the quotes and escapes the debugger shows taken off, and it is fetched again whole while the program is paused, so a long string that a row cuts short (JavaScript shows about 1,000 characters) opens complete. At an earlier stop in Debug History, it opens what that stop kept. XML is read without its DTD and without loading anything outside the text.
Viewing a collection as a table
View as Table (debug.viewSelectedAsTable), in the right-click menu of a
Variables, watch or evaluate result row that holds a list, array, slice, set
or map, opens the collection in
a window of its own, as IntelliJ IDEA and Visual Studio do: a row for each
element and a column for each of its fields, so a list of orders reads as a
table of their ids, customers and totals. The first column is the element’s
index, or a map’s key; an element with no fields, such as a number, shows its
value. The debugger’s own rows under a collection, such as Python’s special
variables or an array’s length, are left out.
- Click a column’s heading to sort by it. Numbers sort by value, so
10comes after9. - The Filter rows field keeps the rows that mention what you type in any cell.
- Copy (Ctrl+C) puts the selected rows, or every row shown, on the clipboard as tab-separated text, ready to paste into a spreadsheet.
- Open as CSV (
debug.openTableAsCsv) opens the rows shown in a CSV tab. - Refresh (
debug.refreshTable) evaluates the collection again at the current stop and shows what it holds now; it needs the program paused.
The table keeps the values of the stop it was opened at, and its note says so, such as 12 elements, as at this stop, so you can step on and compare. A large collection shows its first 1,000 elements, and the note says how many there are. Each collection opens its own window. Type renderers apply to the cells. Checked with Python, Java and Go.
DataFrames and numpy arrays
In a Python program, the row is named View as DataFrame on a pandas DataFrame or Series, and View as Array on a numpy array, as PyCharm’s data viewer does. It opens the data’s rows, not the object’s attributes:
- Columns keep their names, and hovering a column’s heading shows its dtype. The heading of the window says the kind and the shape.
- A Series, or an array of one dimension, is a single column of values. A structured array’s fields are its columns.
- An array of more dimensions is laid out as rows of its last one, each row
named by the indexes before it, such as
(1, 2). - The first 1,000 rows show; Load More brings the next 1,000.
Filter, sort, Copy and Open as CSV work as for any table, and Refresh reads the first rows again while the program is paused.
Type renderers
A type renderer chooses how the debugger shows a value of one type, as IntelliJ
IDEA’s type renderers and Visual Studio’s natvis do: a Money as 12.50 EUR
rather than Money@1f3a, and, when unfolded, the fields or expressions that
matter instead of every field. The debugger’s own children stay under a last
row, [Raw View].
Right-click a value in Variables and choose Customize Rendering…
(debug.customizeSelectedRendering) to make one for that value’s type, or to change the one it has. The form has:
- Type: the type’s name, filled in from the row, such as
com.shop.MoneyorMoney. - Language: the debugged language it applies to, or Any language.
- Value: an expression for the value shown on the row, such as
this.amount + " " + this.currency. Empty keeps the debugger’s own. - Children: one
name = expressionper line, such asowner = this.owner.name. Empty keeps the debugger’s own children. - Enabled, to keep a renderer without using it.
Expressions are written in the debugged program’s language and evaluated where
it stopped, with this (or self) for the value. A value of a subclass has its
own type, so a renderer for Item does not apply to a SpecialItem. A value
or child that can’t be evaluated keeps the debugger’s value, or shows its
message.
Renderers are listed under Settings → Debugging → Type renderers, where Add…, Edit… and Remove manage them. They apply in Variables, watches, the Evaluate window, the hover popup and View as Table. A watch or evaluation whose expression calls a method or assigns is not evaluated a second time for its renderer, so it never runs twice. Setting the value of a renderer’s child assigns to its expression.
Mute Type Renderers (debug.muteRenderers), in the Variables tree’s
right-click menu and Run ▸ Debugger, shows every value as the debugger gives
it; run it again to turn the renderers back on. Checked with Java, Python and
Go.
Debug History
The Debug window keeps each stop of a session as it was shown: the call stack, the values you looked at in Variables, your watches, the inline values and the pinned values. After the program has run on, you can go back to an earlier stop and read them again. Editora keeps the stops itself and asks the debugger for nothing, so this works with every language’s debugger.
- Back and Forward, the ‹ and › buttons in the Debug window’s toolbar (or Debug: Back and Debug: Forward), go to the stop before or after the one shown.
- Debug: Show History… (
debug.showHistory) lists the stops, each with its number, time, why it stopped and where. Pick one to go back to it.
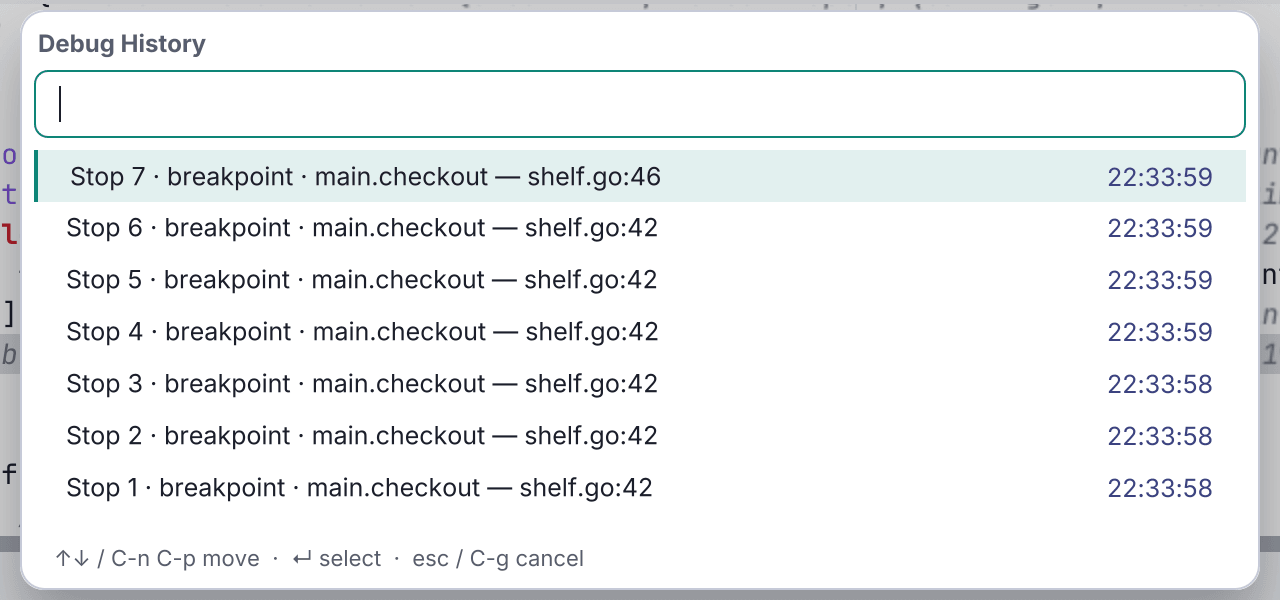
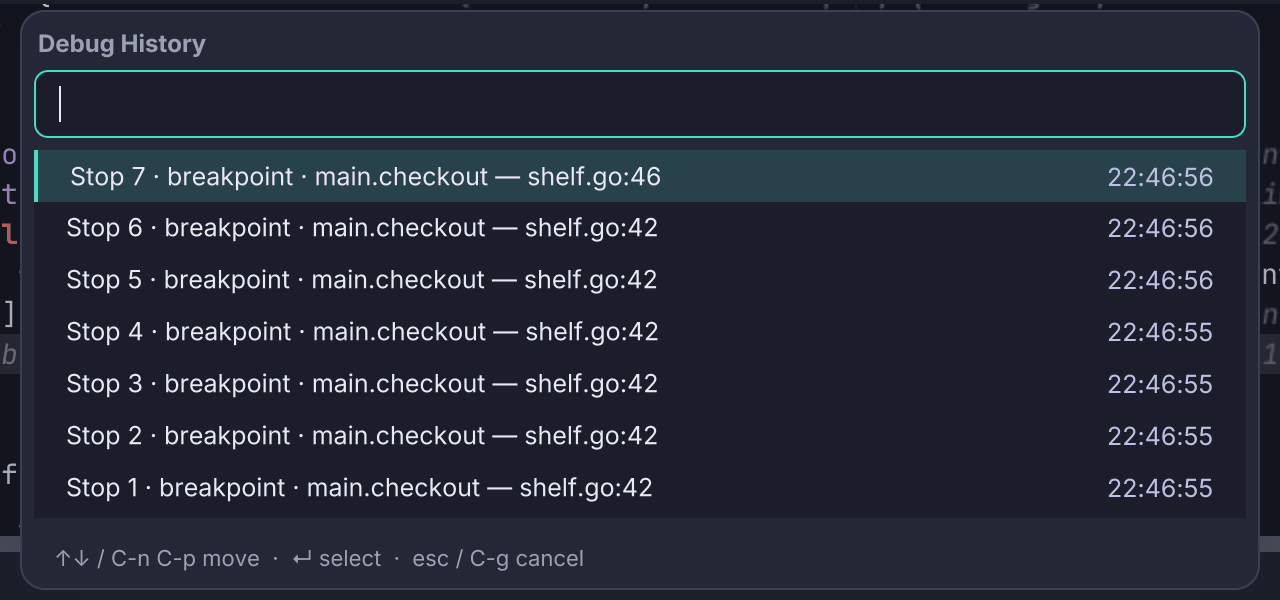
An earlier stop is shown read-only. A banner above the Debug window says which stop it is, when and where it stopped, and that the values are as they were then; its Back to the live stop button returns to the program as it is now. The stop’s call stack and values fill the Debug window, values that changed since the stop before are highlighted as usual, and the editor marks the stop’s line grey, with its inline and pinned values. Hovering a name evaluates nothing there. Forward from the last stop, a step, Continue or a new stop also return to the live stop.
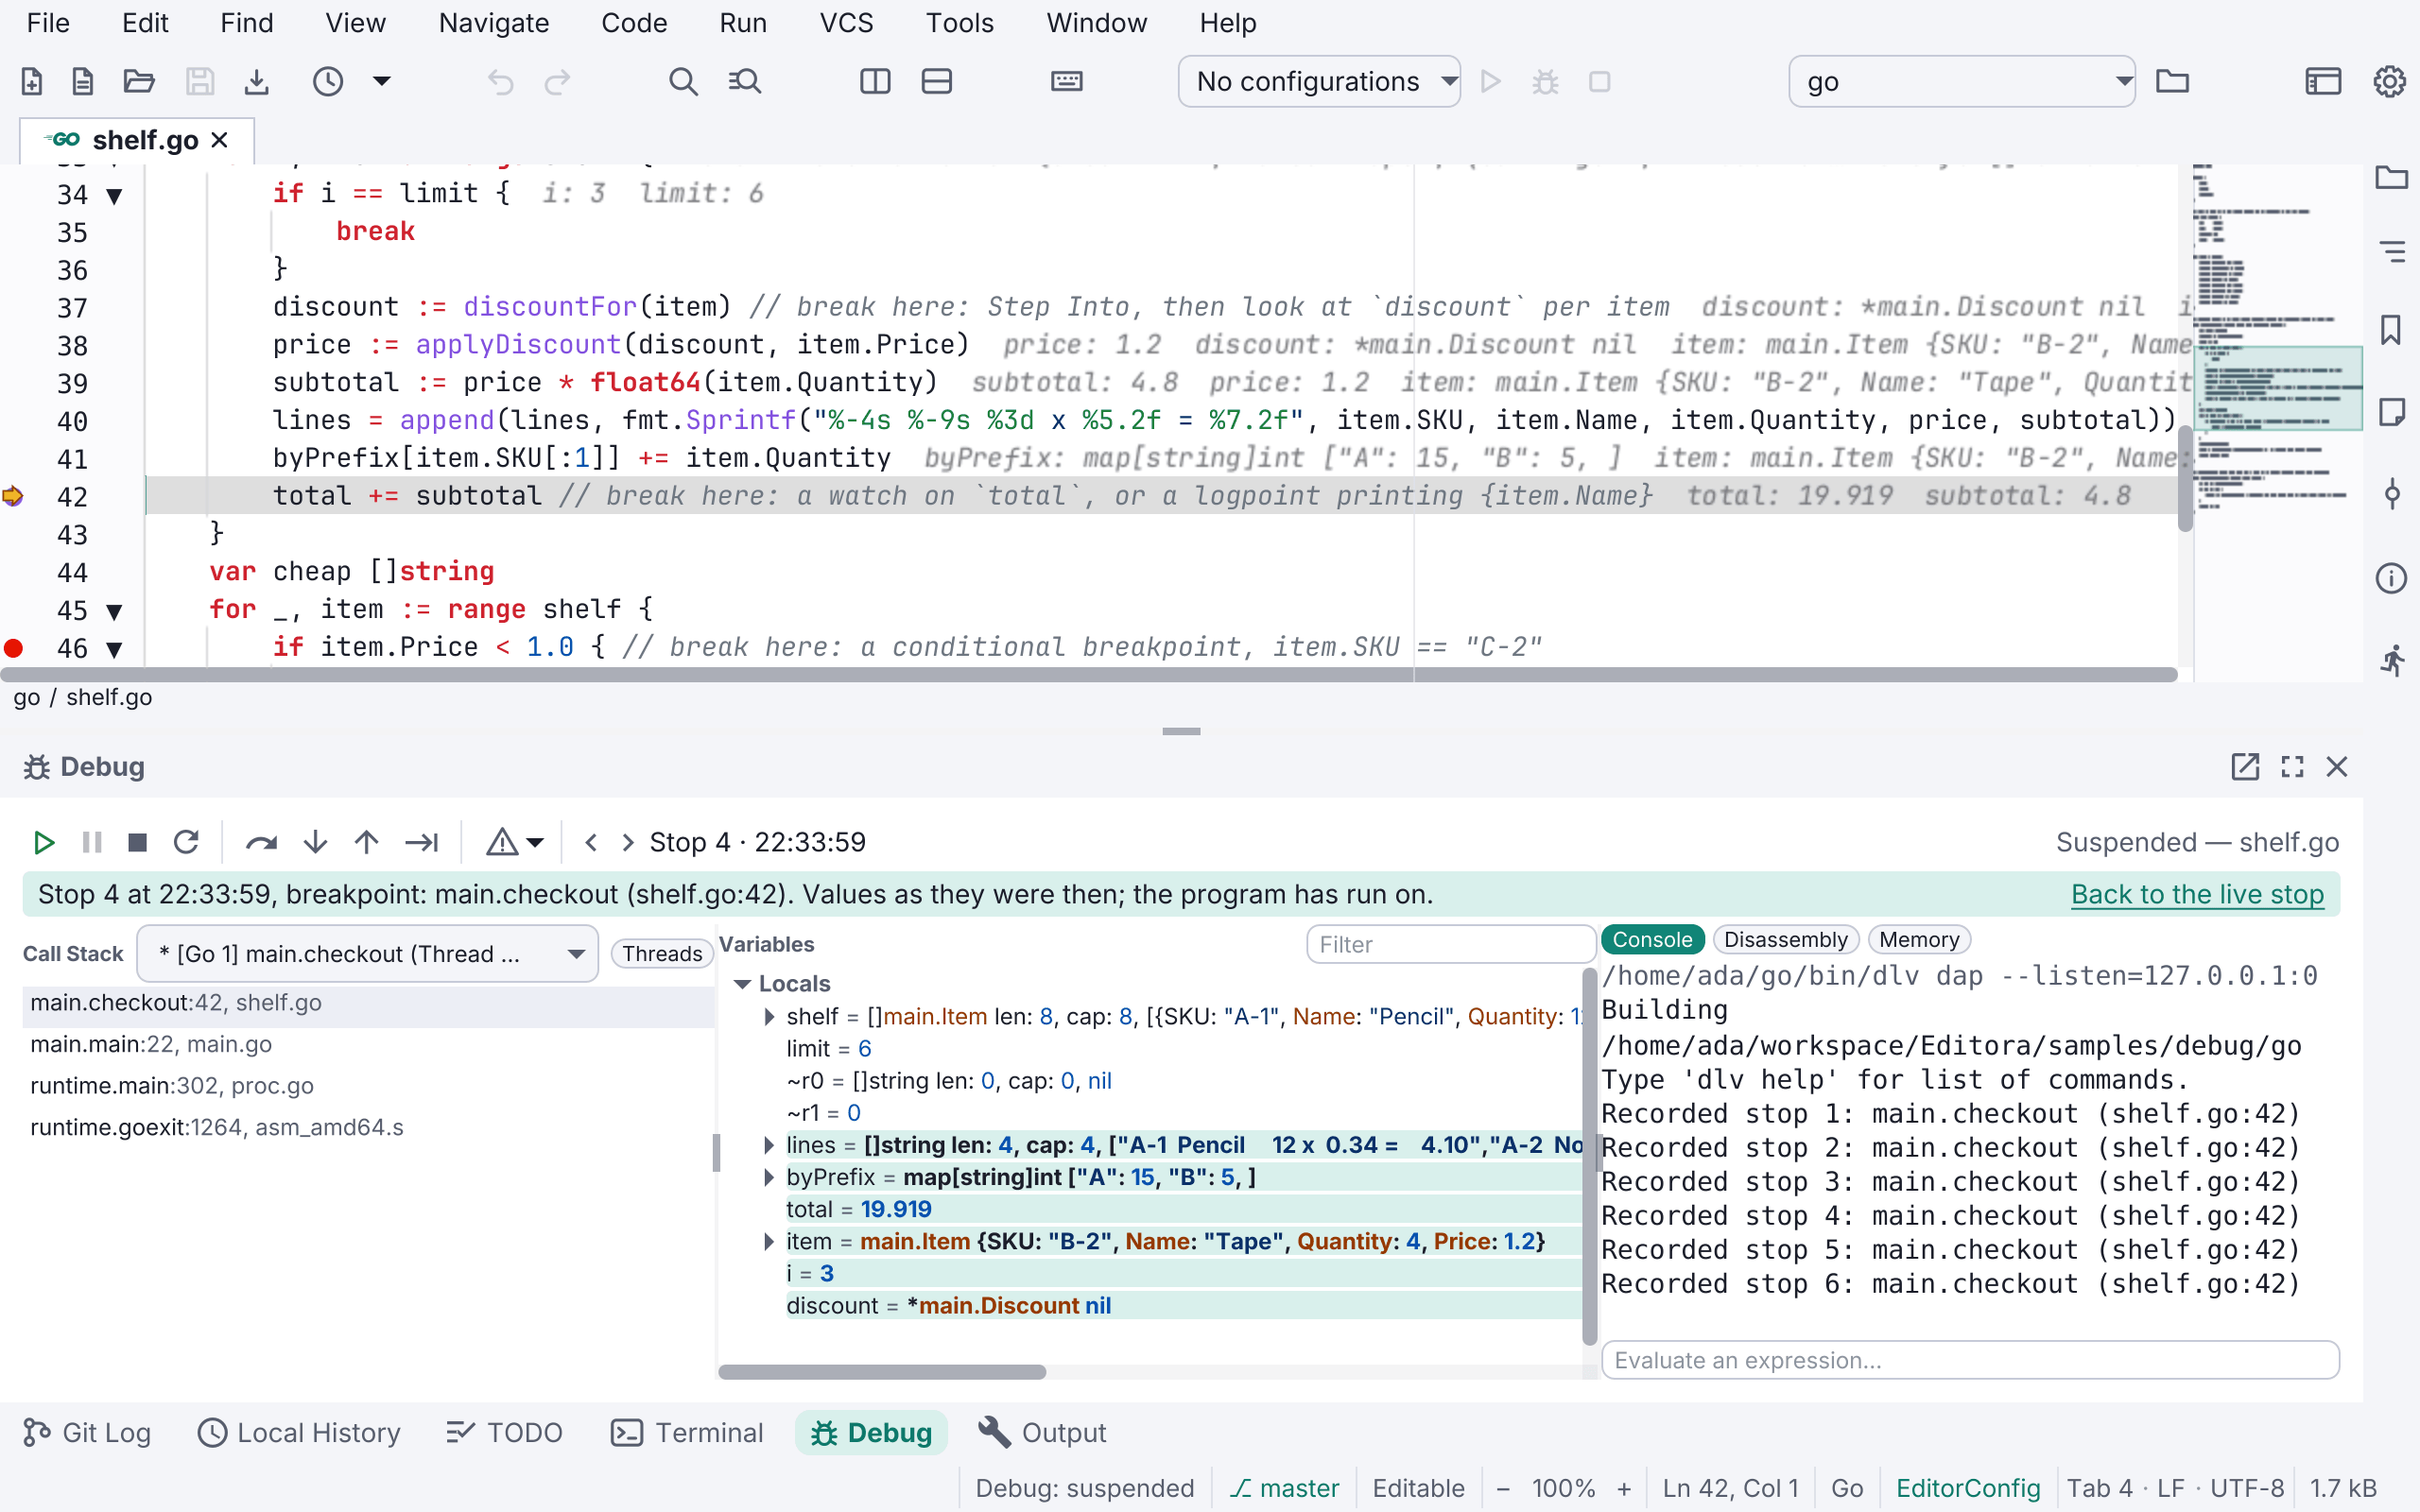
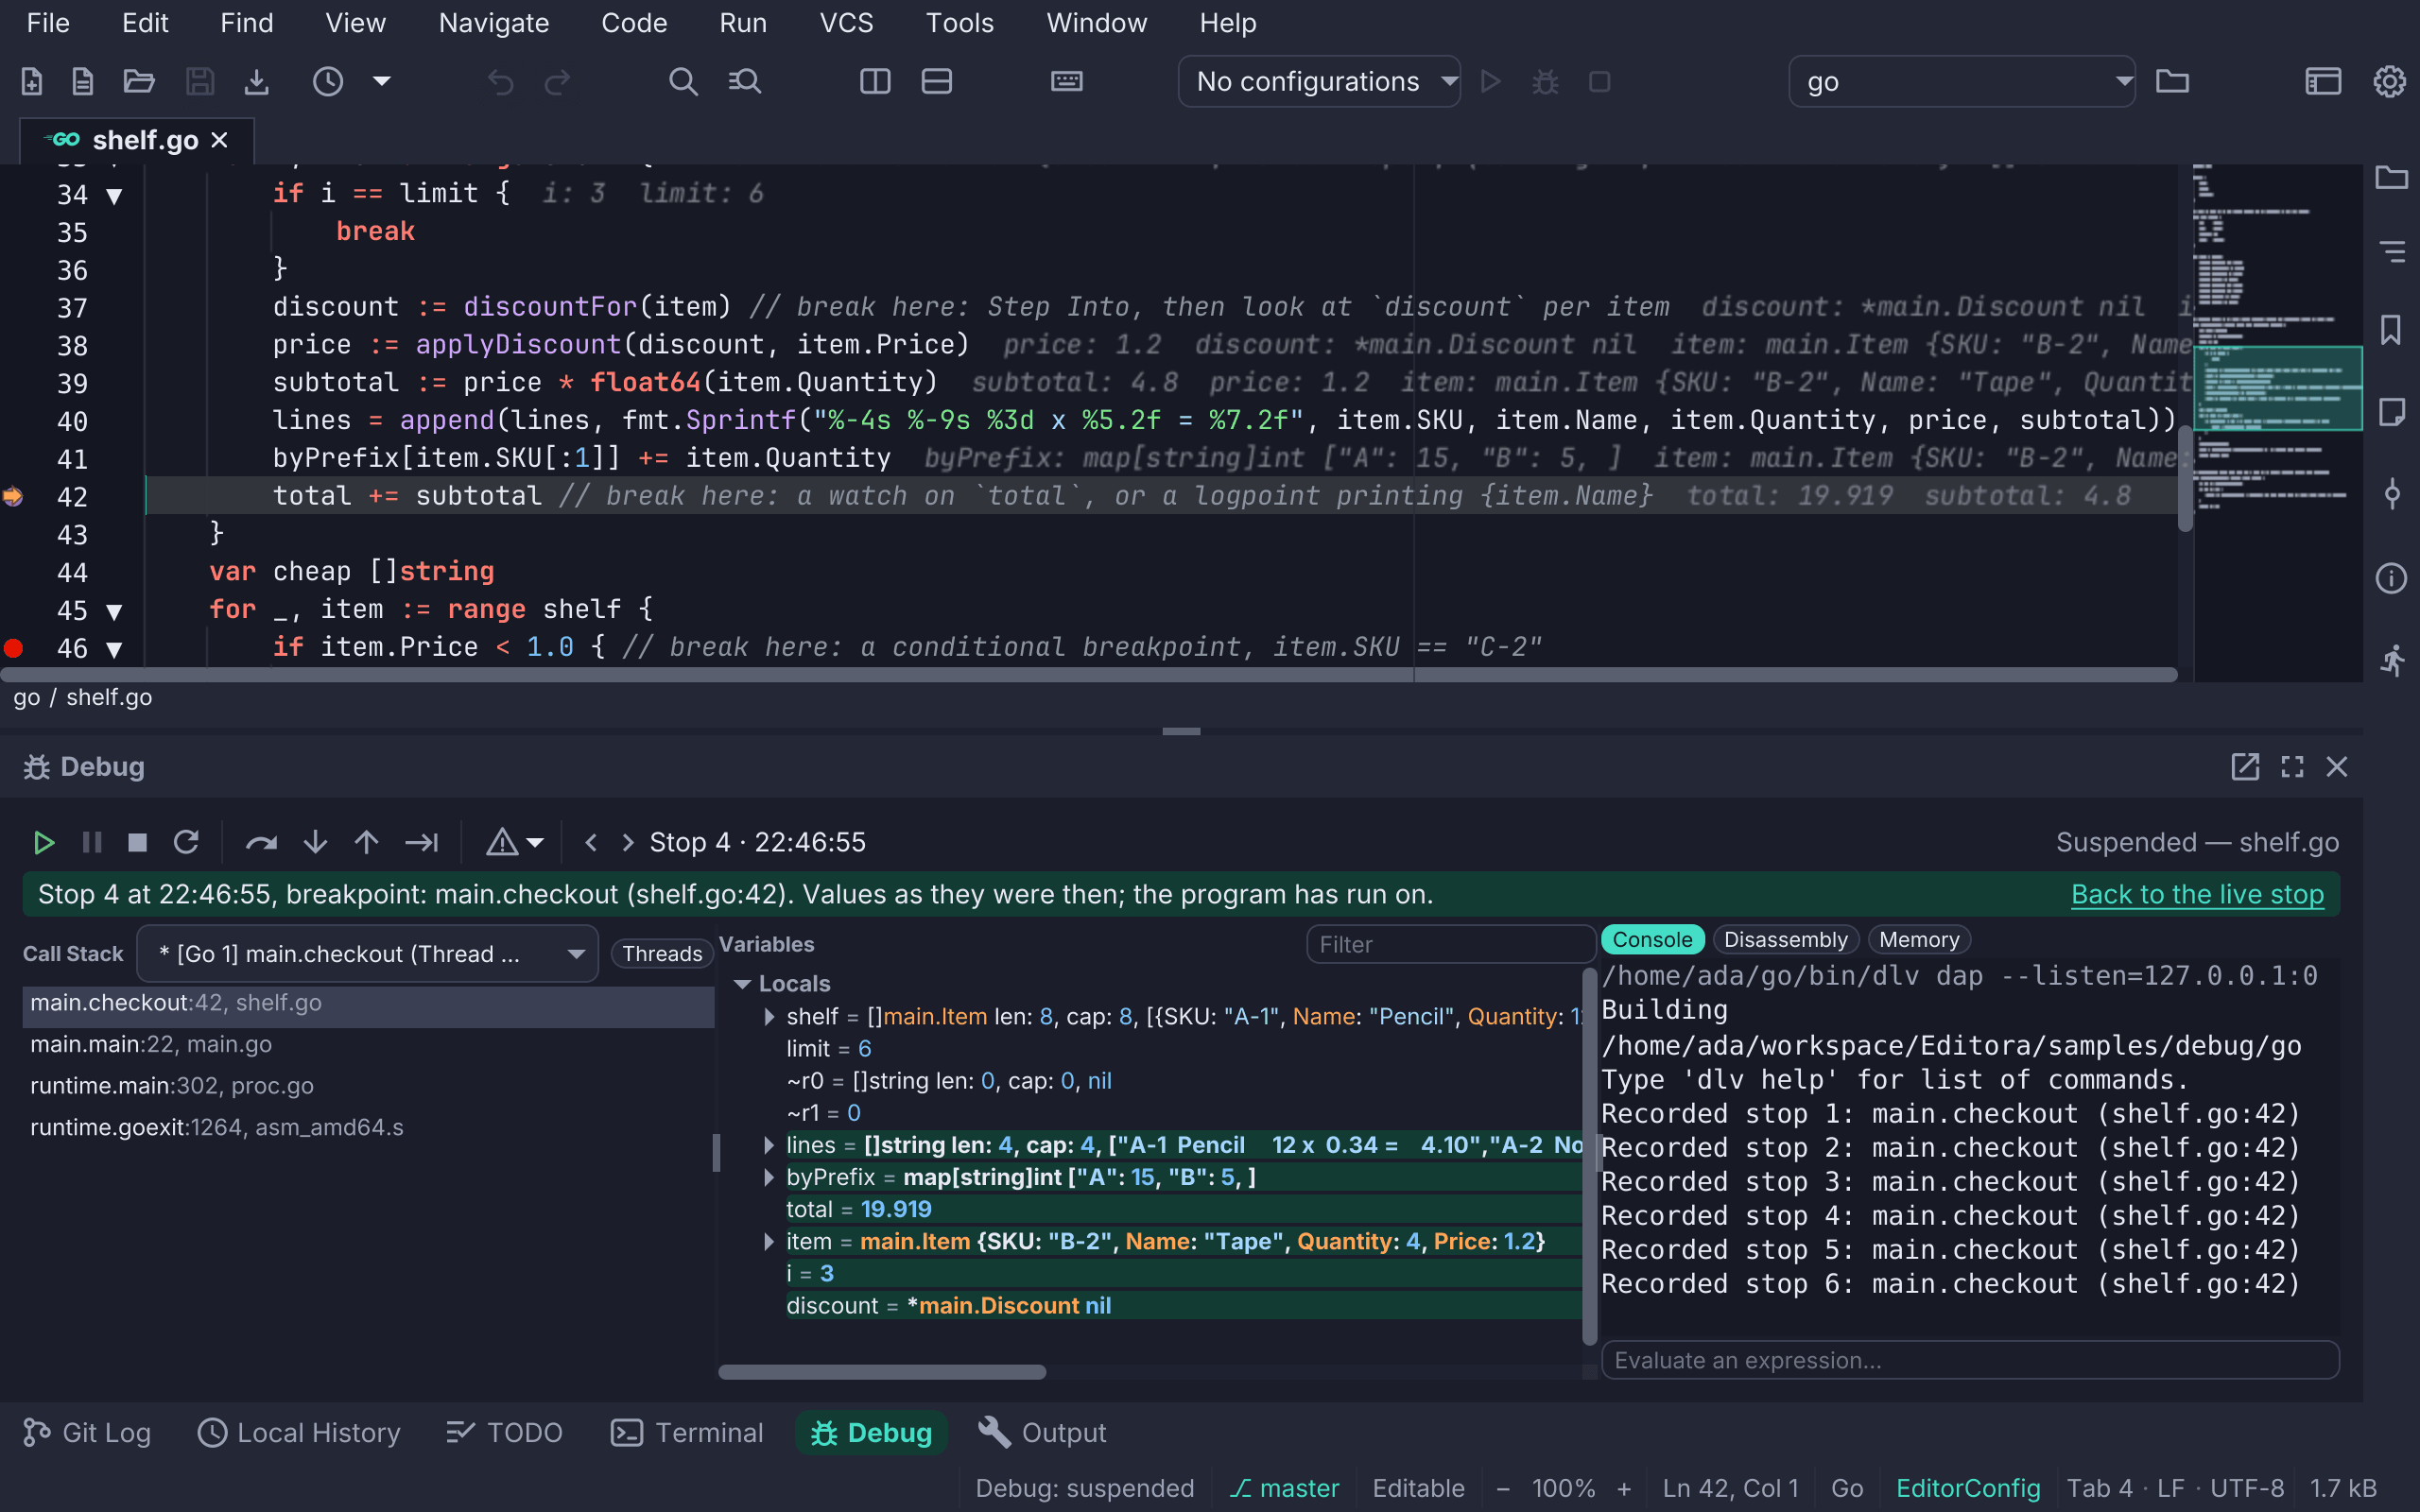
Only values that were fetched while the stop was live are kept. A row nobody unfolded at that stop reads (not opened at that stop), since its children were never asked for and the program has moved on.
Show Value History, in the right-click menu of a Variables or Watches row
(debug.selectedValueHistory), lists that row’s value at every kept stop of the same frame and marks the ones
that changed. Pick one to go back to that stop. At an earlier stop, the menu
also has Copy Value and Copy Name, since nothing there can be changed.
The stops are kept in memory only, never on disk. A session keeps 200 by default and forgets the oldest past that; Stops kept under Settings → Debugging → History sets it to Off, 50, 200, 1,000 or 5,000. A new session starts an empty history, but after the program ends you can still read the last session’s stops until you start the next one. Recording breakpoints add stops to the history without stopping the program.
Don’t step into
Don’t step into, in Settings → Debugging, lists code that Step Into goes over: a step that lands there leaves at once. An entry can name:
- a class or package:
com.shop.util.* - a module:
requests - a function:
fmt.*,std::* - a file:
**/vendor/**
* stands for any text. Each entry is for one language or every language, and
has its own on/off switch. Add…, Edit… and Remove change the list.
To add the code you are in, right-click a frame in the call stack and choose
Don’t Step Into This… (debug.dontStepIntoFrame, also in
Run ▸ Stepping). It offers the frame’s code as its language names it: the
class in Java, the file in Python (or the npm package in JavaScript), the
package in Go and C#, or the outer namespace in C++ and Rust.
A breakpoint inside code on the list still stops. The Java, Python and JavaScript debuggers, and the other JVM languages’, skip the code themselves; with Go, Rust, C and C++ and the rest, Editora steps back out when a step lands there.
Stepping backward
In a session that can run the program backward, the Debug window has two more
buttons: Step Back (debug.stepBack) goes back over the last statement, with the
variables as they were before it, and Reverse Continue
(debug.reverseContinue) runs backward to the previous breakpoint, or as far
back as the program was recorded. Both are also in Run ▸ Stepping and,
in the Debug window, on the keys b and Shift+C. Unlike
Debug History, which shows a stop as it was without touching
the program, these move the program itself back, and you can step forward
again from there.
For C and C++ debugged with GDB (C and C++ debugger on the
Rust, C and C++ card of Settings → Debugging), turn
on Record Execution (debug.toggleRecording, a toggle button in the Debug
window and in Run ▸ Stepping) while the program is paused. GDB records the program from there, the Debug window’s
state line says recording, and Step Back and Reverse Continue go back over
what ran since. Run it again to stop recording. Recording slows the program
down a great deal, so turn it on just before the part you want to replay, not
at the start. GDB’s recorder needs nothing installed, and it records up to
200,000 machine instructions by default. In a GDB session, Step Back and
Reverse Continue are there from the start but disabled until Record Execution
is on.
A debugger that says it can step back by itself is used as it is: the buttons show in its sessions, and Record Execution is not needed. In a session that can’t run backward, the commands are greyed out in the command palette and say why.
Threads view
The call stack shows one thread at a time, the one picked in the thread
dropdown above it (Debug: Choose Thread…, debug.chooseThread, opens it
from the keyboard). The Threads switch beside that dropdown
(debug.toggleThreadsView) replaces the frames and the dropdown with every
thread of the program. Debug: Threads
(debug.threads, also in Run ▸ Debugger) opens the Debug window on it.
Turn the switch off to see the frames again.
Each row names a thread and its state: Running, or suspended and why:
- Suspended at a breakpoint
- Suspended after a step
- Suspended on an exception
- Paused
- Suspended at its start
- Suspended on entering a method
- Suspended on a field access
The thread on screen, whose frames and variables the Debug window shows, is in bold and marked ▶. The JVM’s own housekeeping threads are left out, unless one of them is suspended.
Right-click a thread to act on it alone:
- Pause Thread (
debug.pauseSelectedThread), on a running thread, suspends that thread alone; the others keep running. Its stop is shown, as any stop is. - Resume Thread (
debug.resumeSelectedThread), on a suspended thread, resumes that thread alone; the others stay suspended. If it was the thread on screen, the next suspended thread is shown. - Show Frames (
debug.showSelectedThreadFrames), on a suspended thread, turns the switch off and shows that thread’s call stack and variables. Enter or a double-click on the row does the same.
The list follows each stop and Continue, and threads that start or end while the program runs update it.
With Python (debugpy), Pause Thread and Resume Thread pause or resume the whole program, not one thread.
Thread Dump
Debug: Thread Dump (debug.threadDump, also in Run ▸ Debugger and the
right-click menus of the Threads view and the call stack)
shows every thread of the program with its call stack, in a window of its own,
as IntelliJ IDEA’s Get Thread Dump does. The threads are listed on the left
with their state, the thread on screen first; the selected one’s call stack is
on the right.
It works on a running program too: Editora pauses it for a moment, takes the dump and lets it go on, without moving the editor to where it was. That is the way to see what a program that hangs is doing. On a paused program, the dump is of the stop.
- Merge identical stacks, on by default, puts threads whose stacks are the same in one row, such as worker-0 and 19 others, so twenty pool workers waiting in one place read as one.
- The Filter threads and frames field finds a thread by its name or by a frame’s text.
- Enter or a double-click on a frame opens its code at its line, even after the program went on: the dump is a snapshot.
- Copy (
debug.copyDump) puts the dump on the clipboard as text, laid out asjstackprints one; Open as Text (debug.openDumpAsText) opens it in a read-only tab; Take Again takes a new one.
A thread that was running when the dump was taken has no call stack, and the window says so and suggests Pause, then Take Again. That happens with Java when a breakpoint stops only its own thread (see Threads in a Java program). Thread Dump works with Java, Python, Go and every other debugger that lists threads; Go’s goroutines are listed as threads.
Parallel Stacks
Debug: Parallel Stacks (debug.parallelStacks, beside Thread Dump in
Run ▸ Debugger and the Threads view’s and call stack’s menus) draws every
thread’s call stack as one tree, as Visual Studio’s Parallel Stacks window
does. The outermost calls are at the bottom. Threads that went through the same
calls share a box, which names how many threads it holds, and the tree branches
where they went different ways, so twenty workers waiting in one place are one
box of twenty threads. A frame whose threads are on different lines of the same
function says several lines.
The thread on screen is highlighted all the way up, through each box it passes
and its own top frame. A click on a frame, or Enter on it, opens its line.
Copy (debug.copyDump too) puts the tree on the clipboard as indented
text, and Take Again draws it anew. As with Thread Dump, a running program is paused for a moment
and goes on, and threads that were running at a stop, with no stack to draw,
are counted in a note. Checked with Python, Java and Go.
Filtering Variables
The Filter field beside the Variables heading narrows each scope to the
variables whose name contains what you type, ignoring case: id keeps id,
userId and ID_PREFIX. Rows that arrive later, such as the next page of a
scope, are filtered as they come. Watches are never filtered. In the field, Esc
clears it and Down moves into the Variables tree.
Long lists and arrays
A list or array opens 100 elements at a time in Variables and Watches; the last
row reads Show N more… (M remaining). Once a list or array with more than
100 elements is open, its right-click menu has Go to Index…
(debug.goToSelectedIndex), which asks for
an index from 0 to the last one and shows the elements from there, still 100 at
a time. The index can be written 250, [250], 1_000 or 1,000. Go to
Index 0 goes back to the start. While you look at a part of a list this way,
its other children, such as a Java list’s fields, are left out.
Hexadecimal values
Debug: Show Numbers as Hexadecimal (debug.toggleHex), also in
Run ▸ Debugger and as a check item in the Variables tree’s right-click
menu, shows
integer values in hexadecimal in Variables, watches, the hover popup and inline
values, so 255 reads 0xff. Run it again to go back to decimal. The values
are fetched again at once, and the switch holds for later sessions until you
turn it off or quit Editora. Switching does not mark every number as
changed.
The debugger formats the numbers: the Java and Python debuggers do, JavaScript’s does not, so a JavaScript program’s numbers stay decimal. CodeLLDB and Delve ignore it too; Show Value As works with every debugger.
Show Value As
Right-click a whole number in Variables or a watch and choose Show Value As ▸ Decimal, Hexadecimal, Binary, Octal or Character to see that one value that way, while the others stay as they are. As the Debugger Shows It goes back.
- A negative number shows as its two’s complement for its type:
-42as anintis0xffffffd6. Acharshows its code. - Chosen on an array or an object, it applies to the numbers inside, except one with its own choice.
- The choice holds at the next stop and in the next session, until the window closes.
- Copy Value copies what is shown.
- On a value that is not a number, the submenu is greyed out and says why.
It works with every debugger. GDB and Delve don’t give a value’s type, so with
them a negative number keeps its sign, such as -0x2a.
Disassembly and Memory
For C, C++, Rust and Go, the Debug window’s third area shows the machine code
and the memory of the program as well as its console, as VS Code, Visual
Studio and IntelliJ do. Three toggles in the area’s header switch between
Console (debug.showConsoleArea), Disassembly and Memory. Debug: Show Disassembly
(debug.showDisassembly) and Debug: Show Memory (debug.showMemory), also
in Run ▸ Debugger, open the Debug window on them. Both views need a
debugger that offers them: CodeLLDB, which debugs Rust, C and C++, and Delve,
which debugs Go, do. With another debugger, the view says it can’t.
Disassembly shows the machine instructions around the selected frame, about 120 of them, with their addresses. The instruction the frame is at is marked and selected, and each run of instructions is labelled with the source line it came from. Double-click an instruction to open its source line. The list is filled again at each stop and when you pick another frame in the call stack.
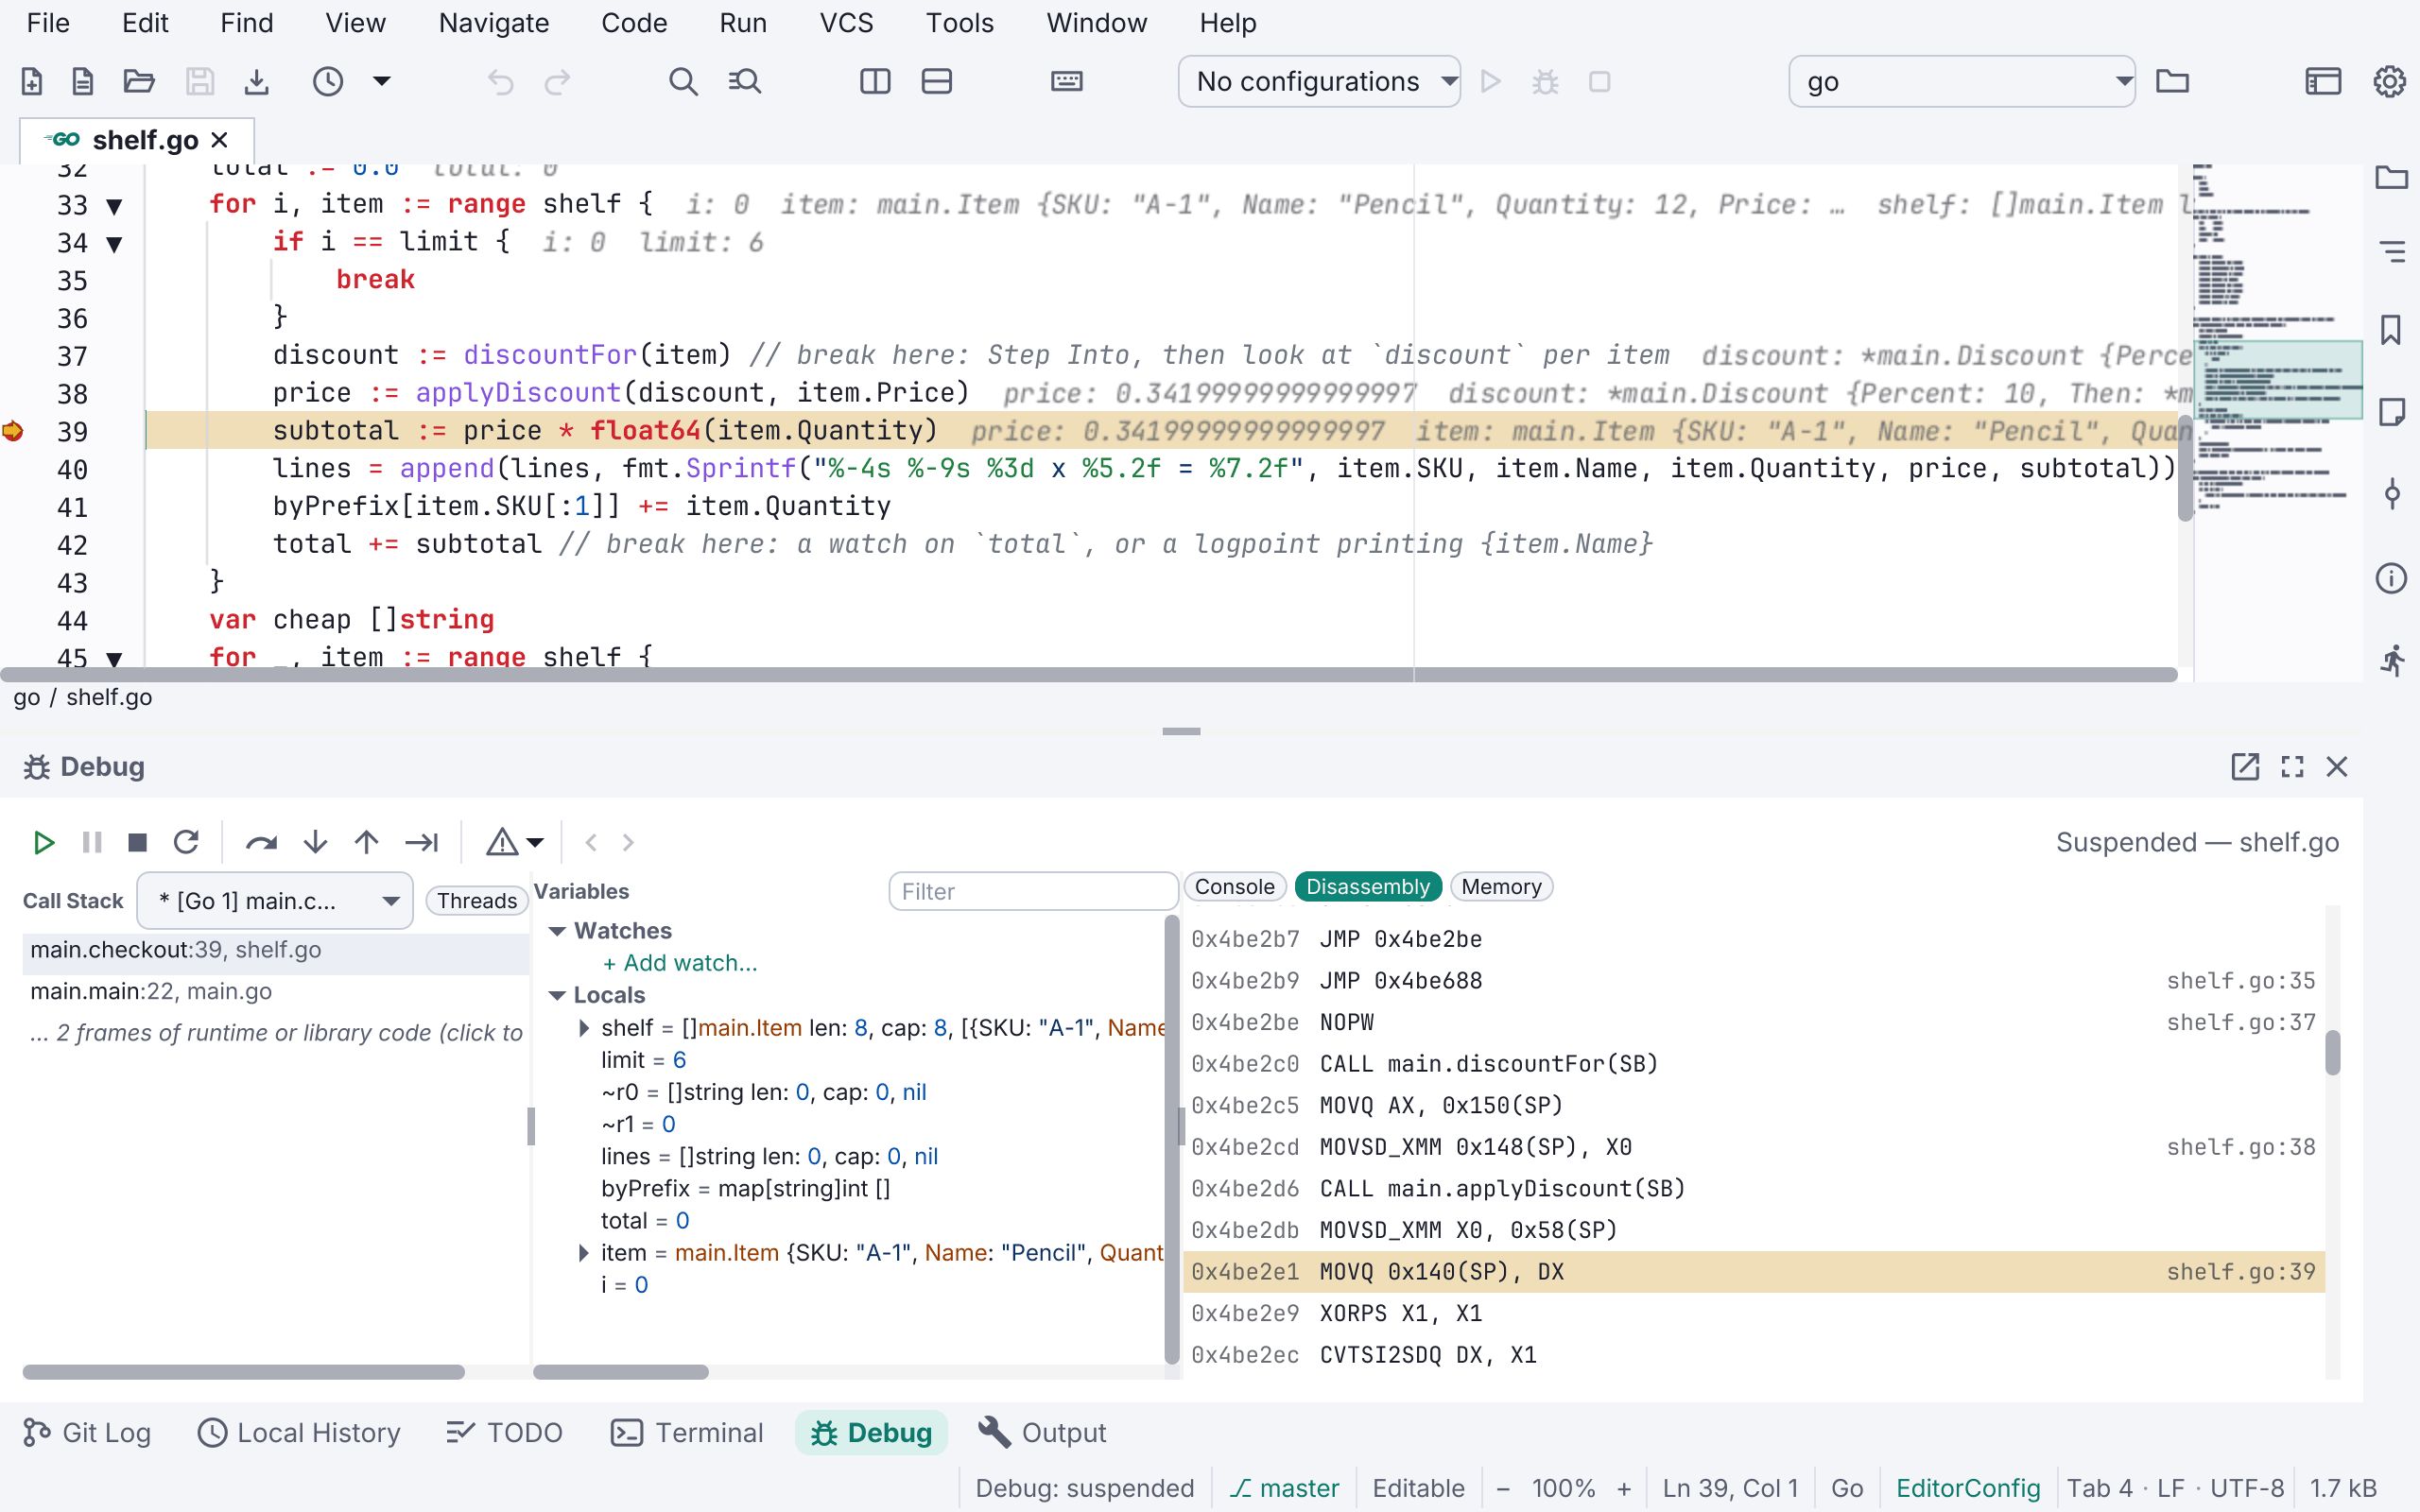
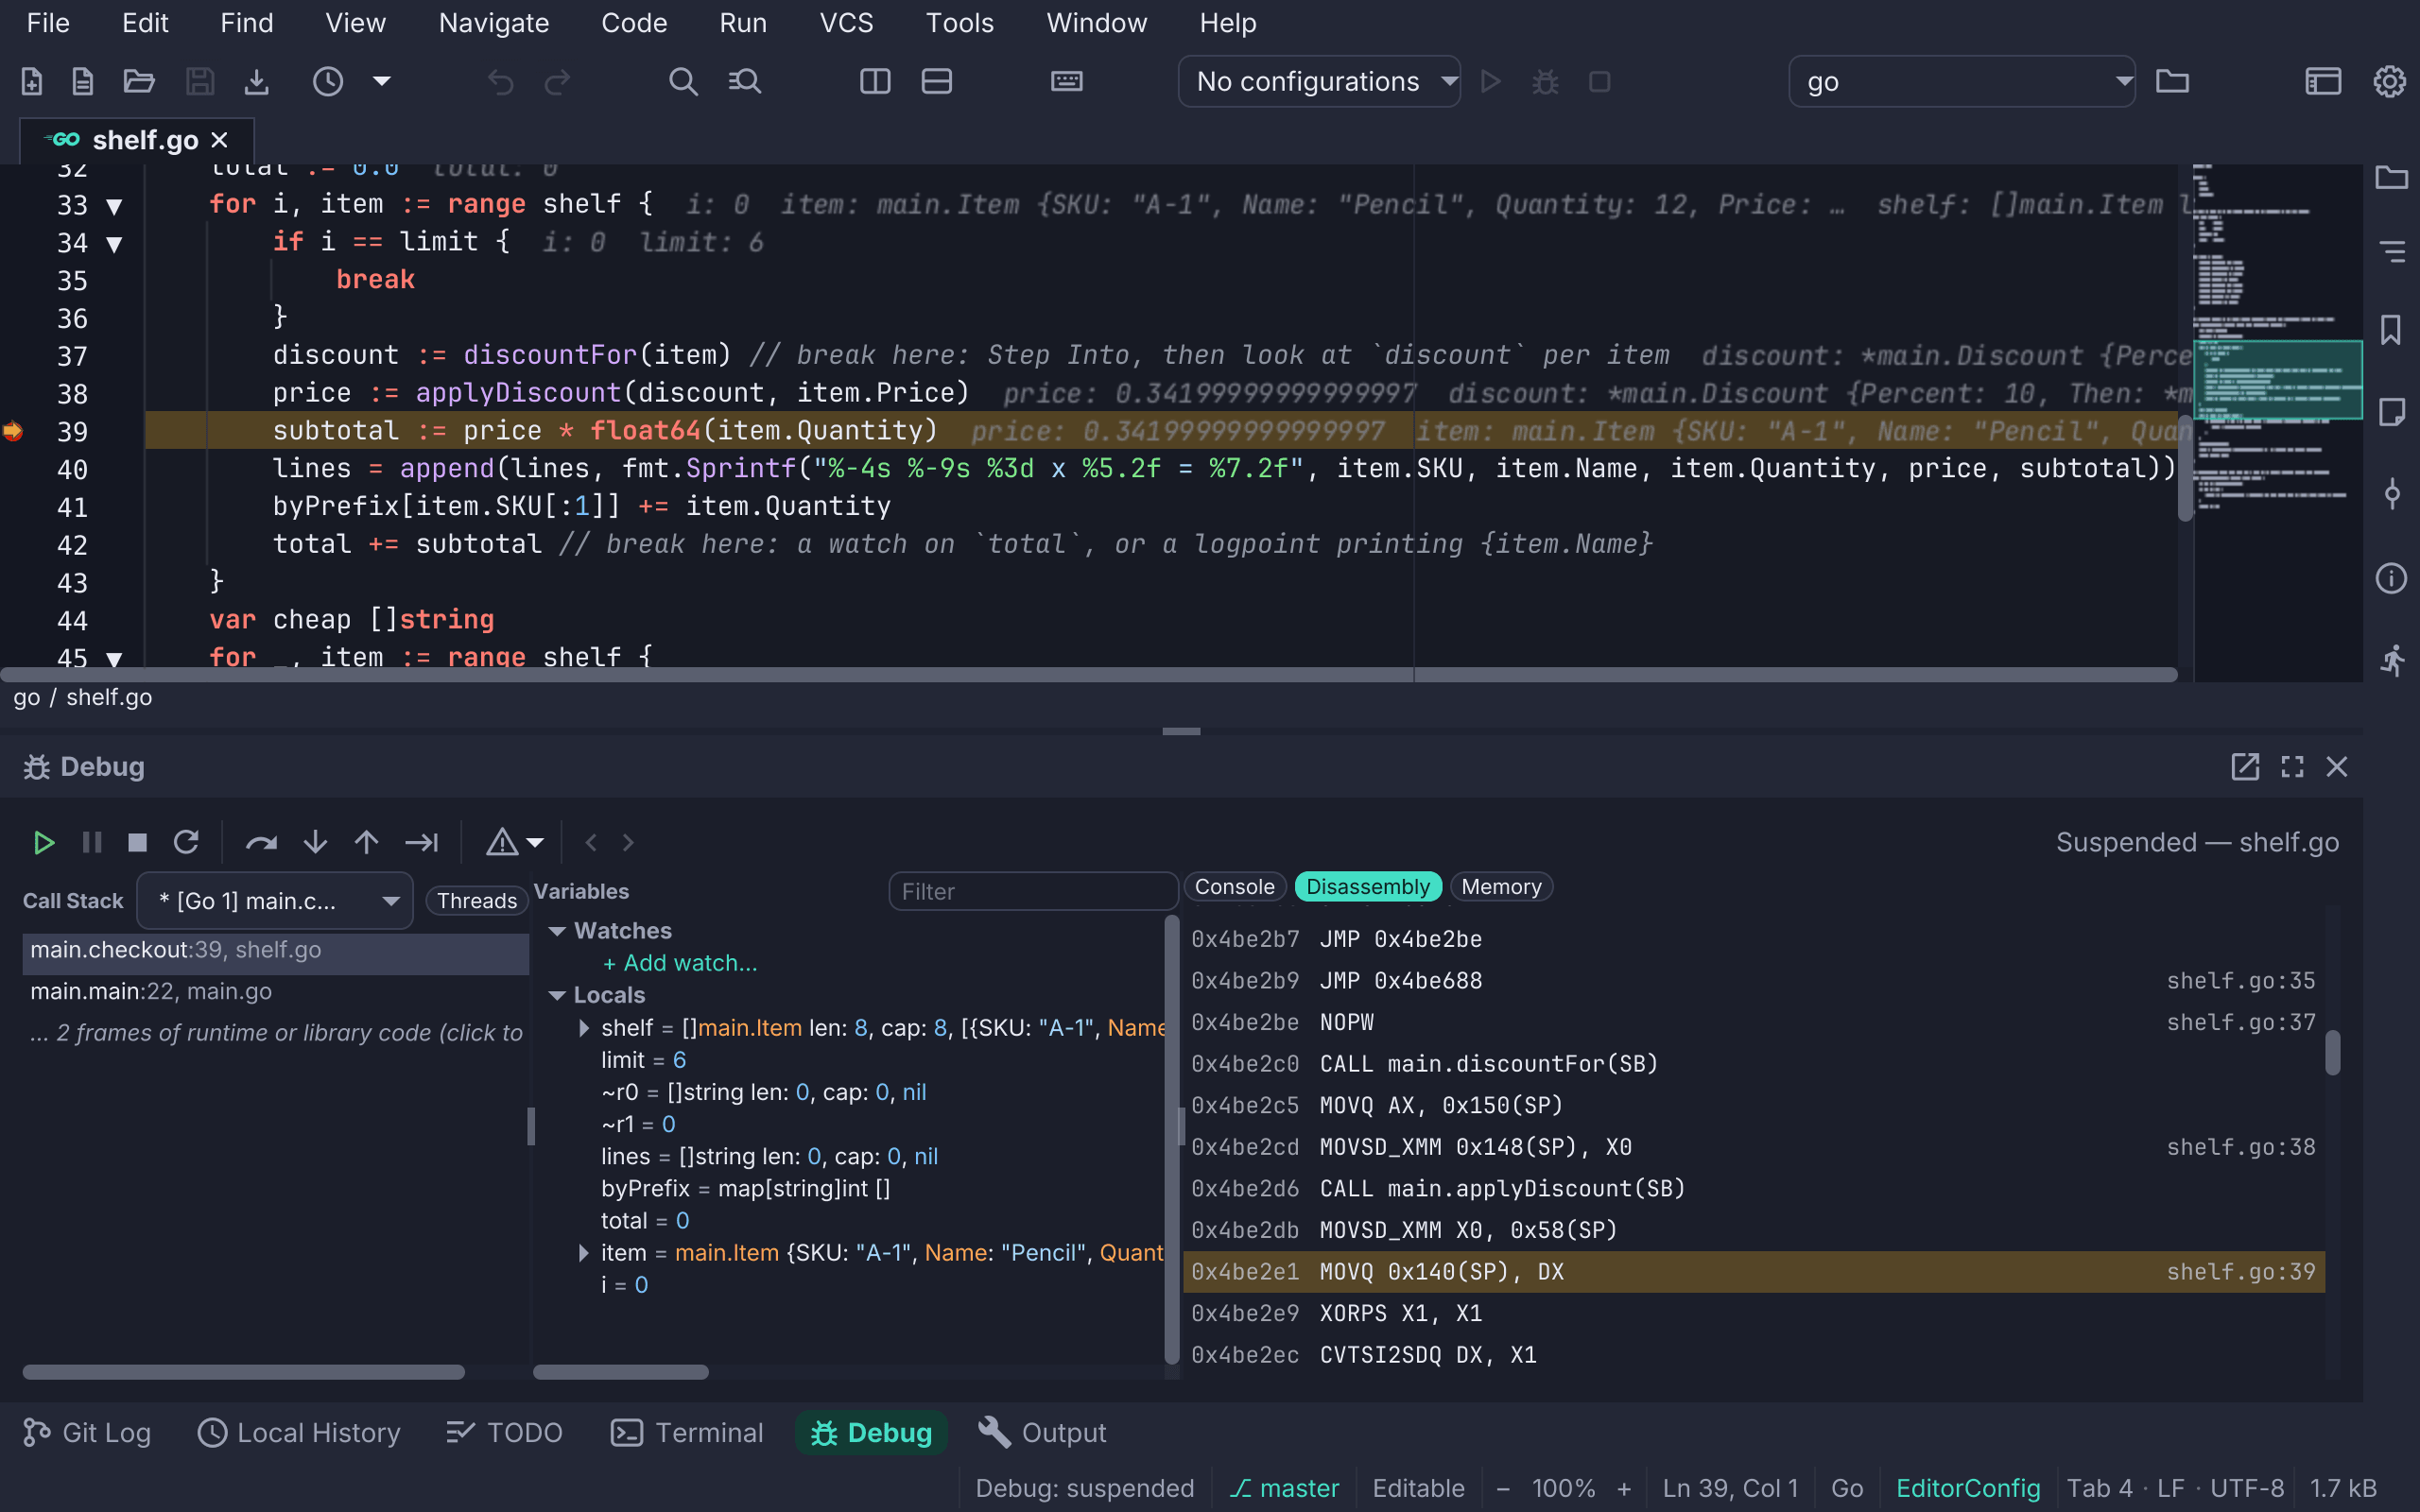
While the Disassembly list has the keyboard, Step Over and Step Into
step one instruction at a time instead of one line, as in VS Code’s
Disassembly view. Debug: Step Over Instruction
(debug.stepOverInstruction) and Debug: Step Into Instruction
(debug.stepIntoInstruction), in Run ▸ Stepping, do it from anywhere; Step
Into Instruction follows a call into the called function. With a debugger that
steps only by line, they say so in the status bar.
Memory shows the program’s memory as rows of 16 bytes: the address, the
bytes in hexadecimal, and the same bytes as text. It reads 256 bytes at a time;
the ◀ and ▶ buttons (debug.memoryPreviousPage, debug.memoryNextPage) show
the 256 bytes before or after. Type an address
(0x…) or an expression, such as a variable’s name, in its field and press
Enter: an expression shows the memory where its value is. View Memory
(debug.viewSelectedMemory), in a variable’s right-click menu in Variables,
opens the view at that variable.
Memory that can’t be read, or an expression with no address, is said in the
view.
Loaded Sources and Modules
While a session runs, two lists show what the program has loaded. Both are in Run ▸ Debugger and the palette, where they are greyed out when no session runs.
Debug: Loaded Sources… (debug.loadedSources), like VS Code’s Loaded
Scripts, lists the scripts and source files the program has loaded: your
project’s files first, then other files, then code the debugger has only in
memory, such as Node.js’s own modules (<node_internals>/…) and code run
through eval. Type to filter it. Enter on a file opens it in its tab, where
breakpoints work as anywhere. Enter on code in memory opens it read-only, with
the text the debugger gives, as Code without a file
describes.
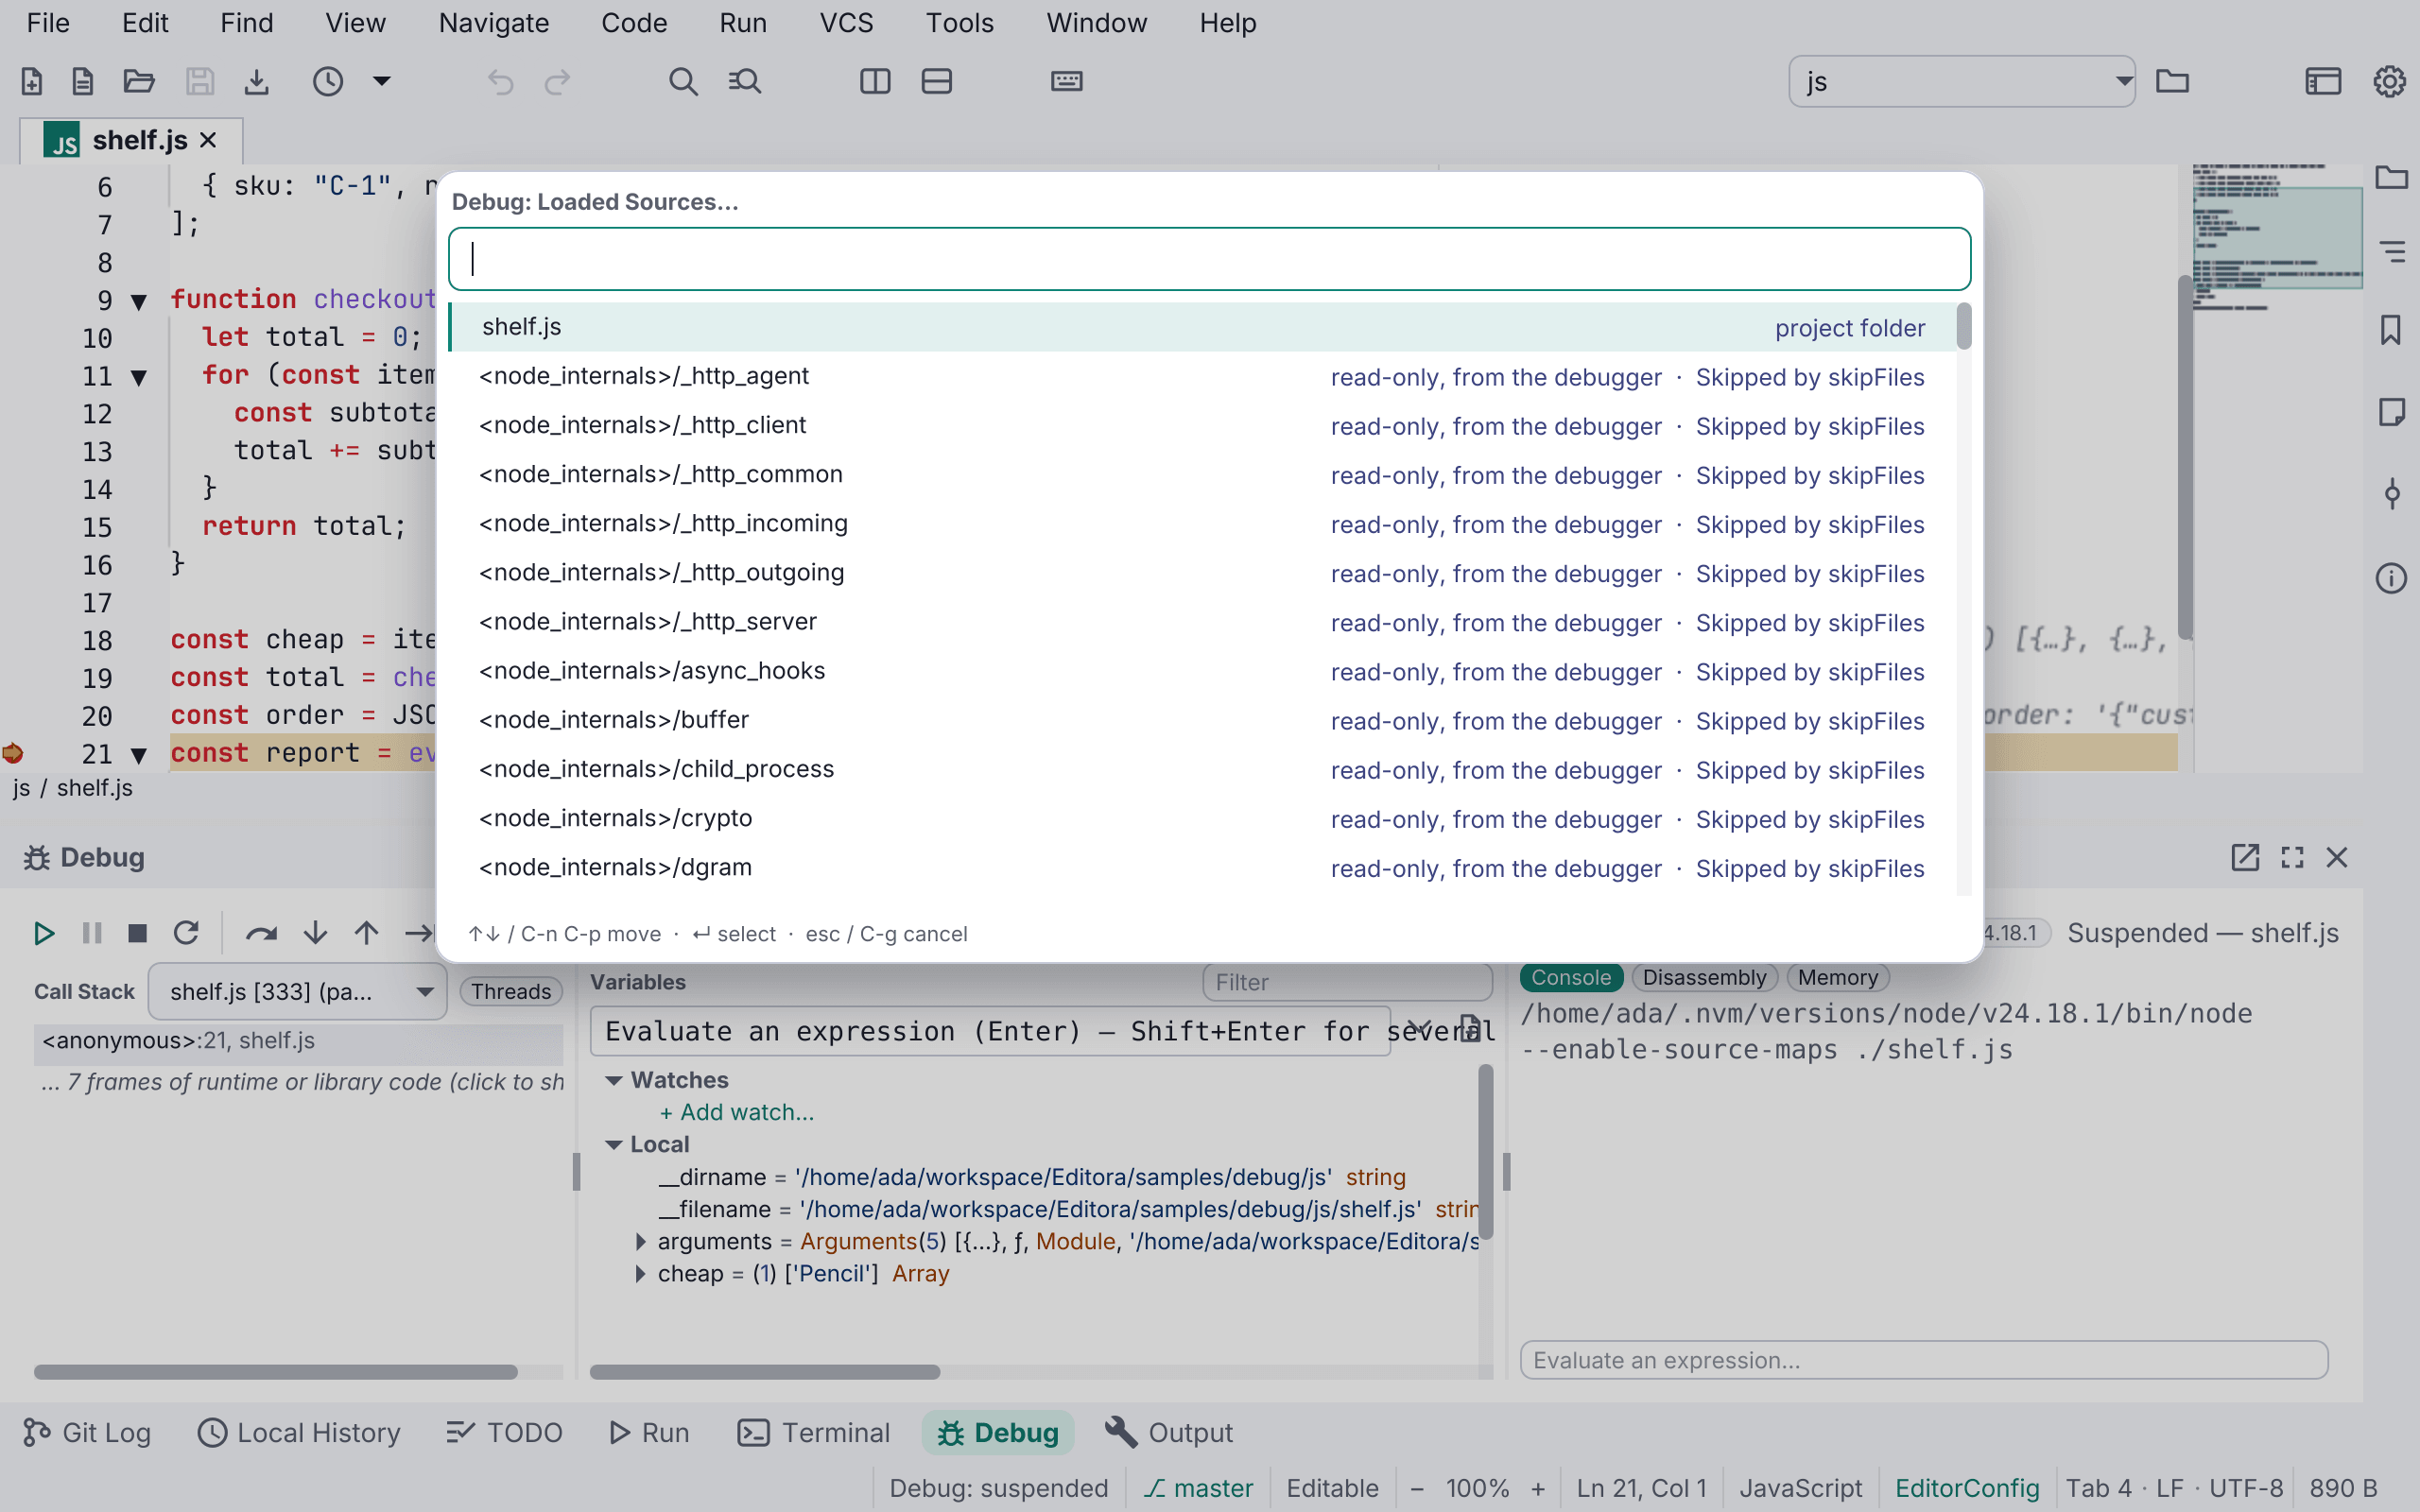
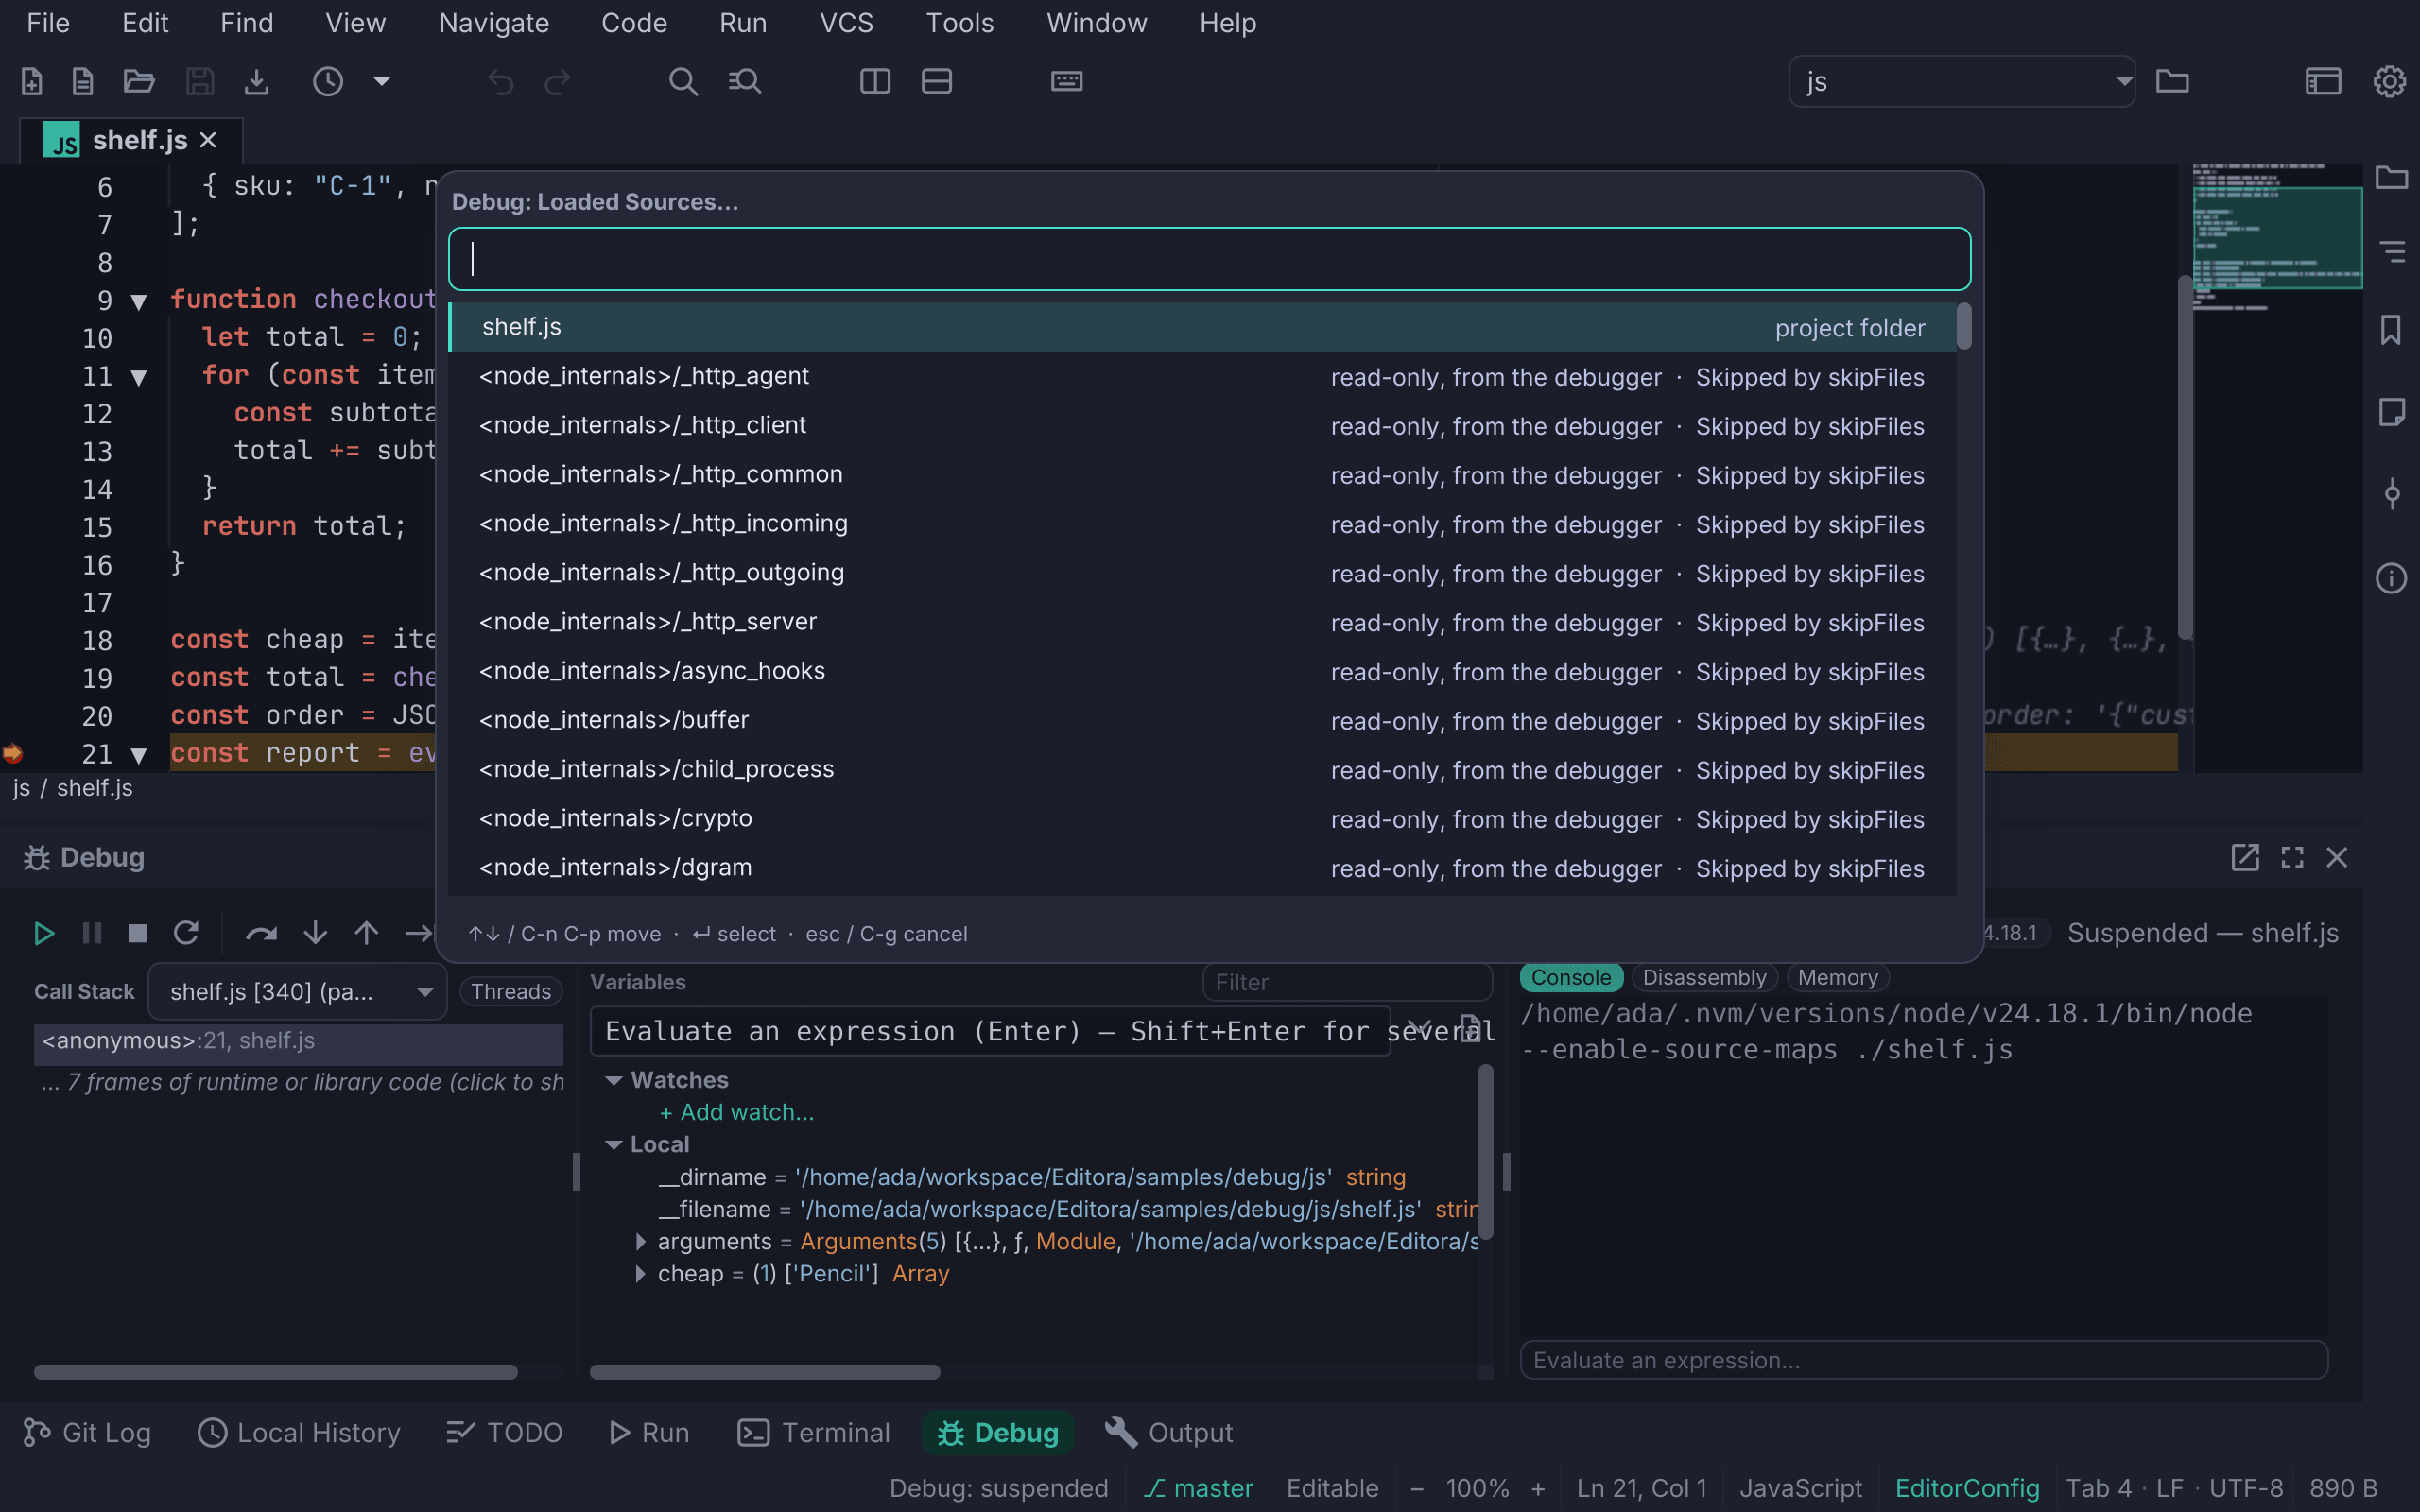
Debug: Modules… (debug.modules), like Visual Studio’s Modules window,
lists the libraries, assemblies or modules the program has loaded, your code
first. Each row shows what the debugger says of it: whether its symbols are
loaded, its version, whether it is your code or optimized, its address range,
and its path. Enter or Alt+C copies the module’s path.
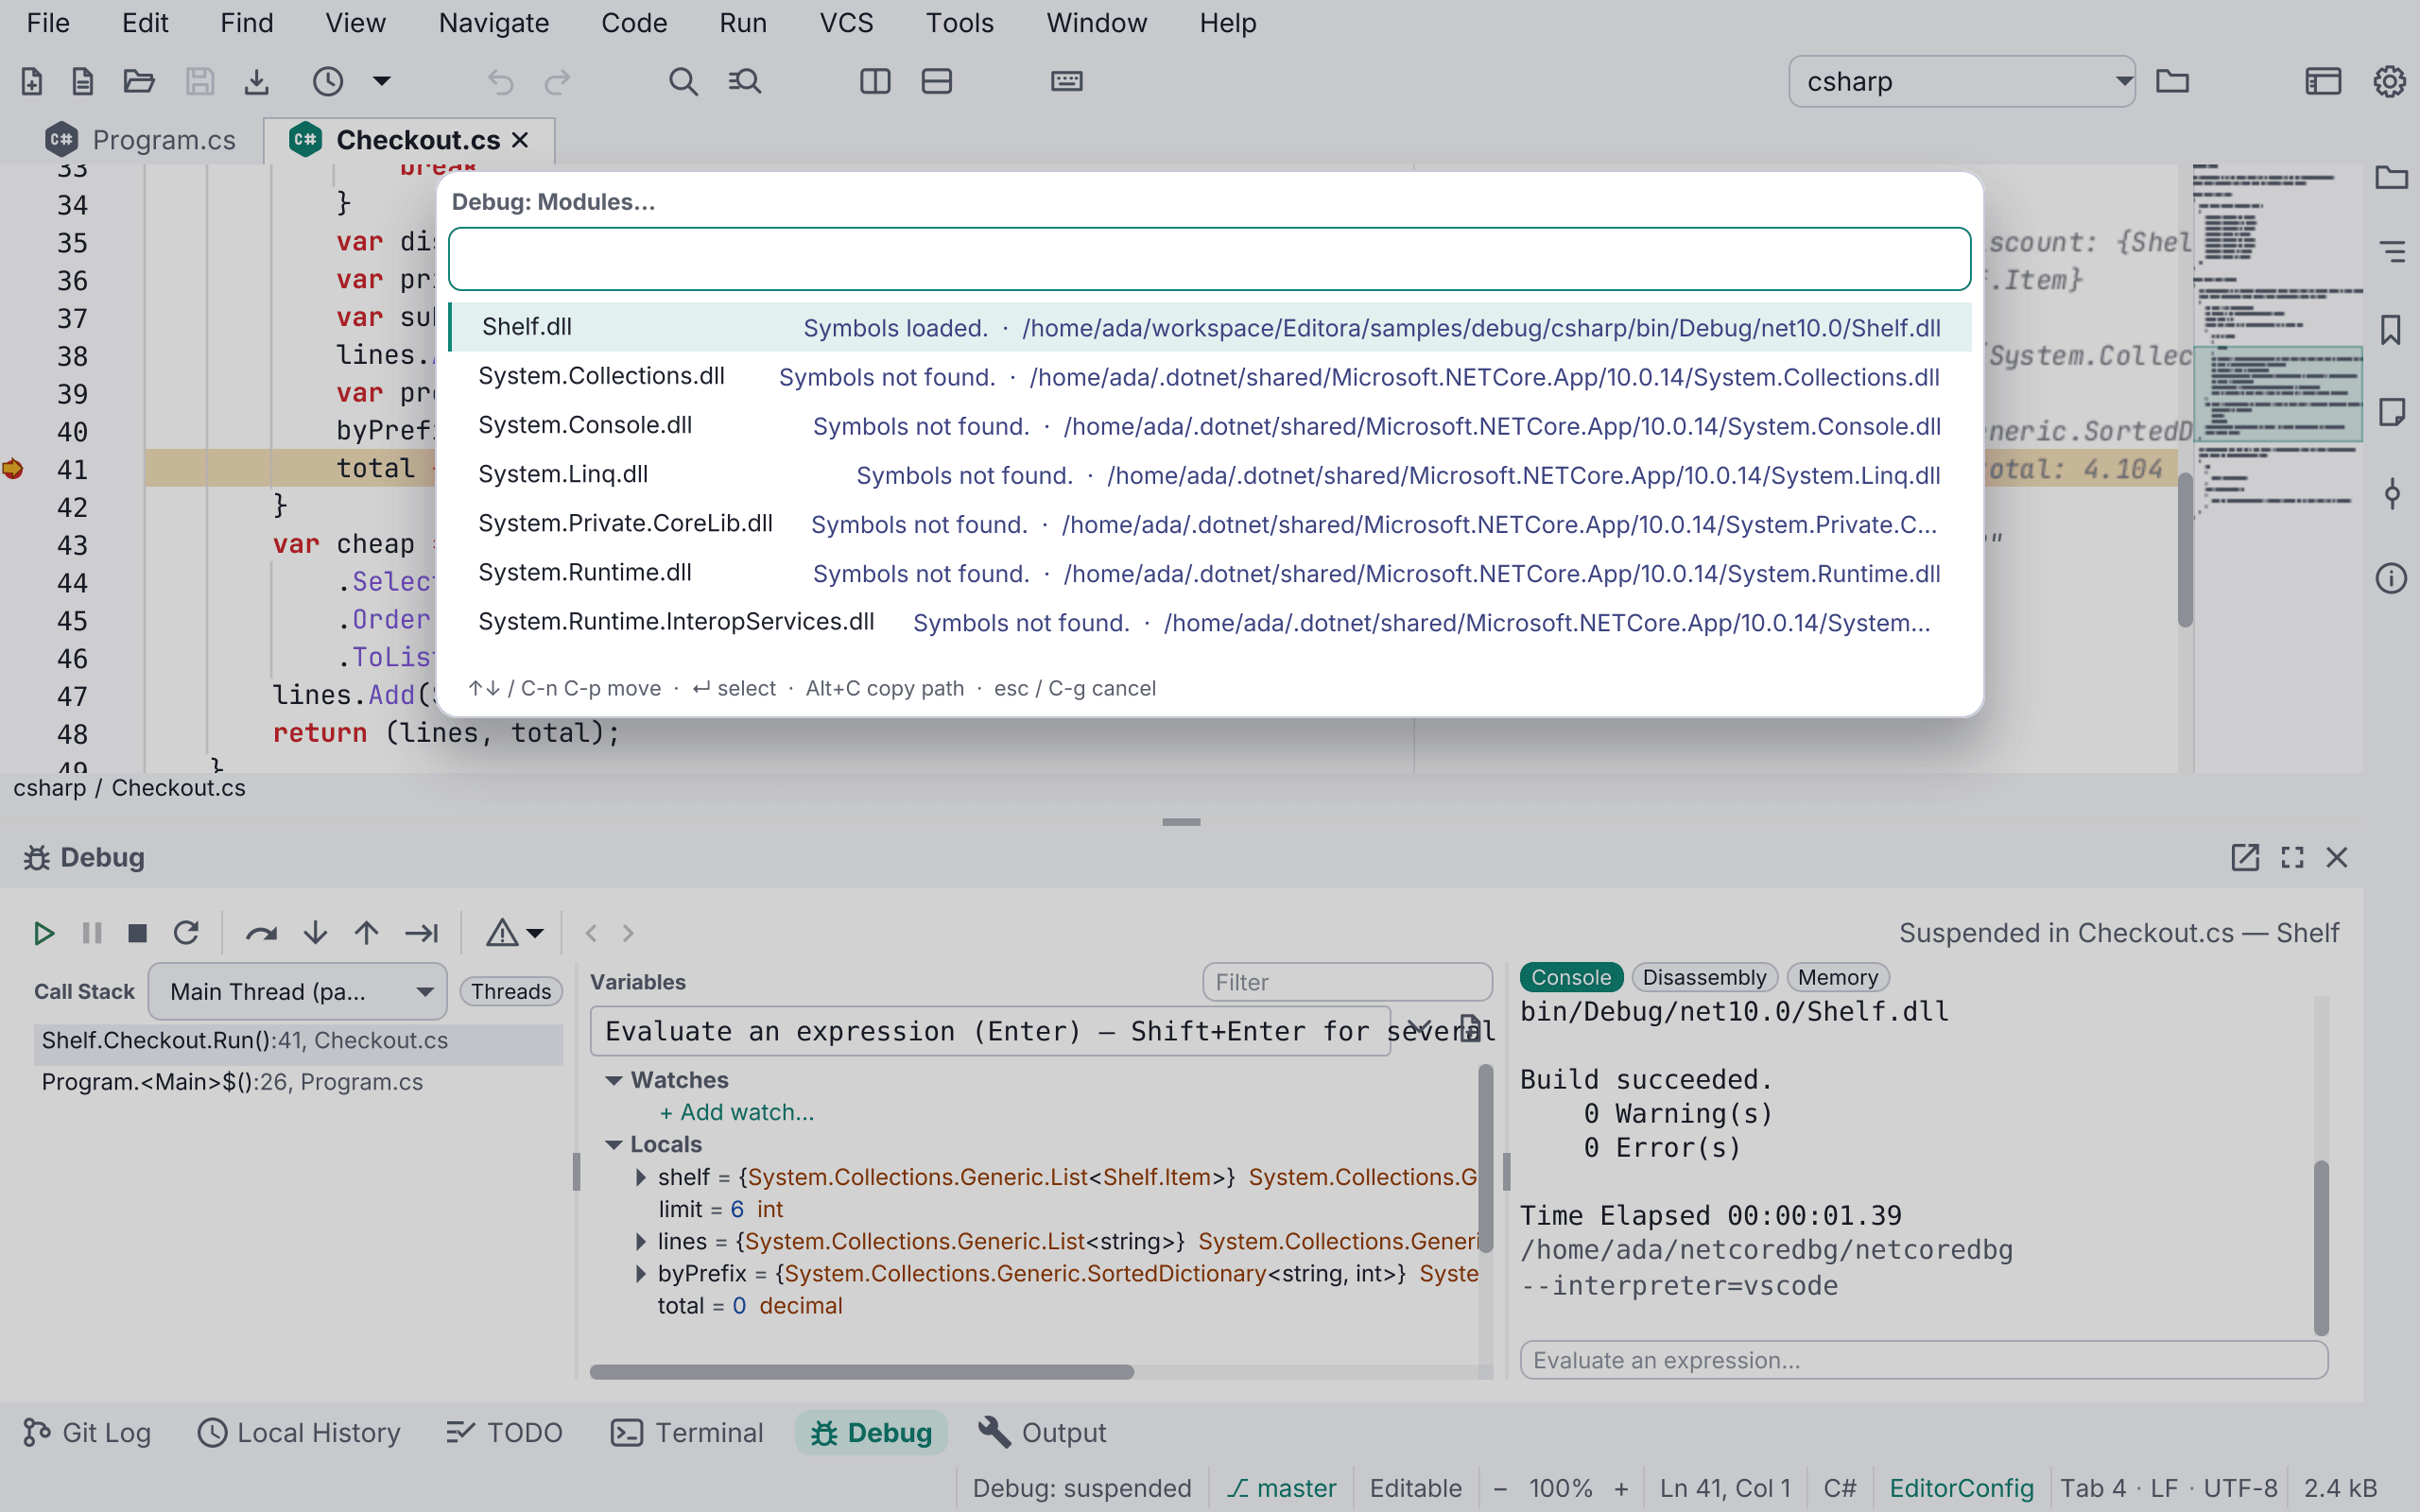
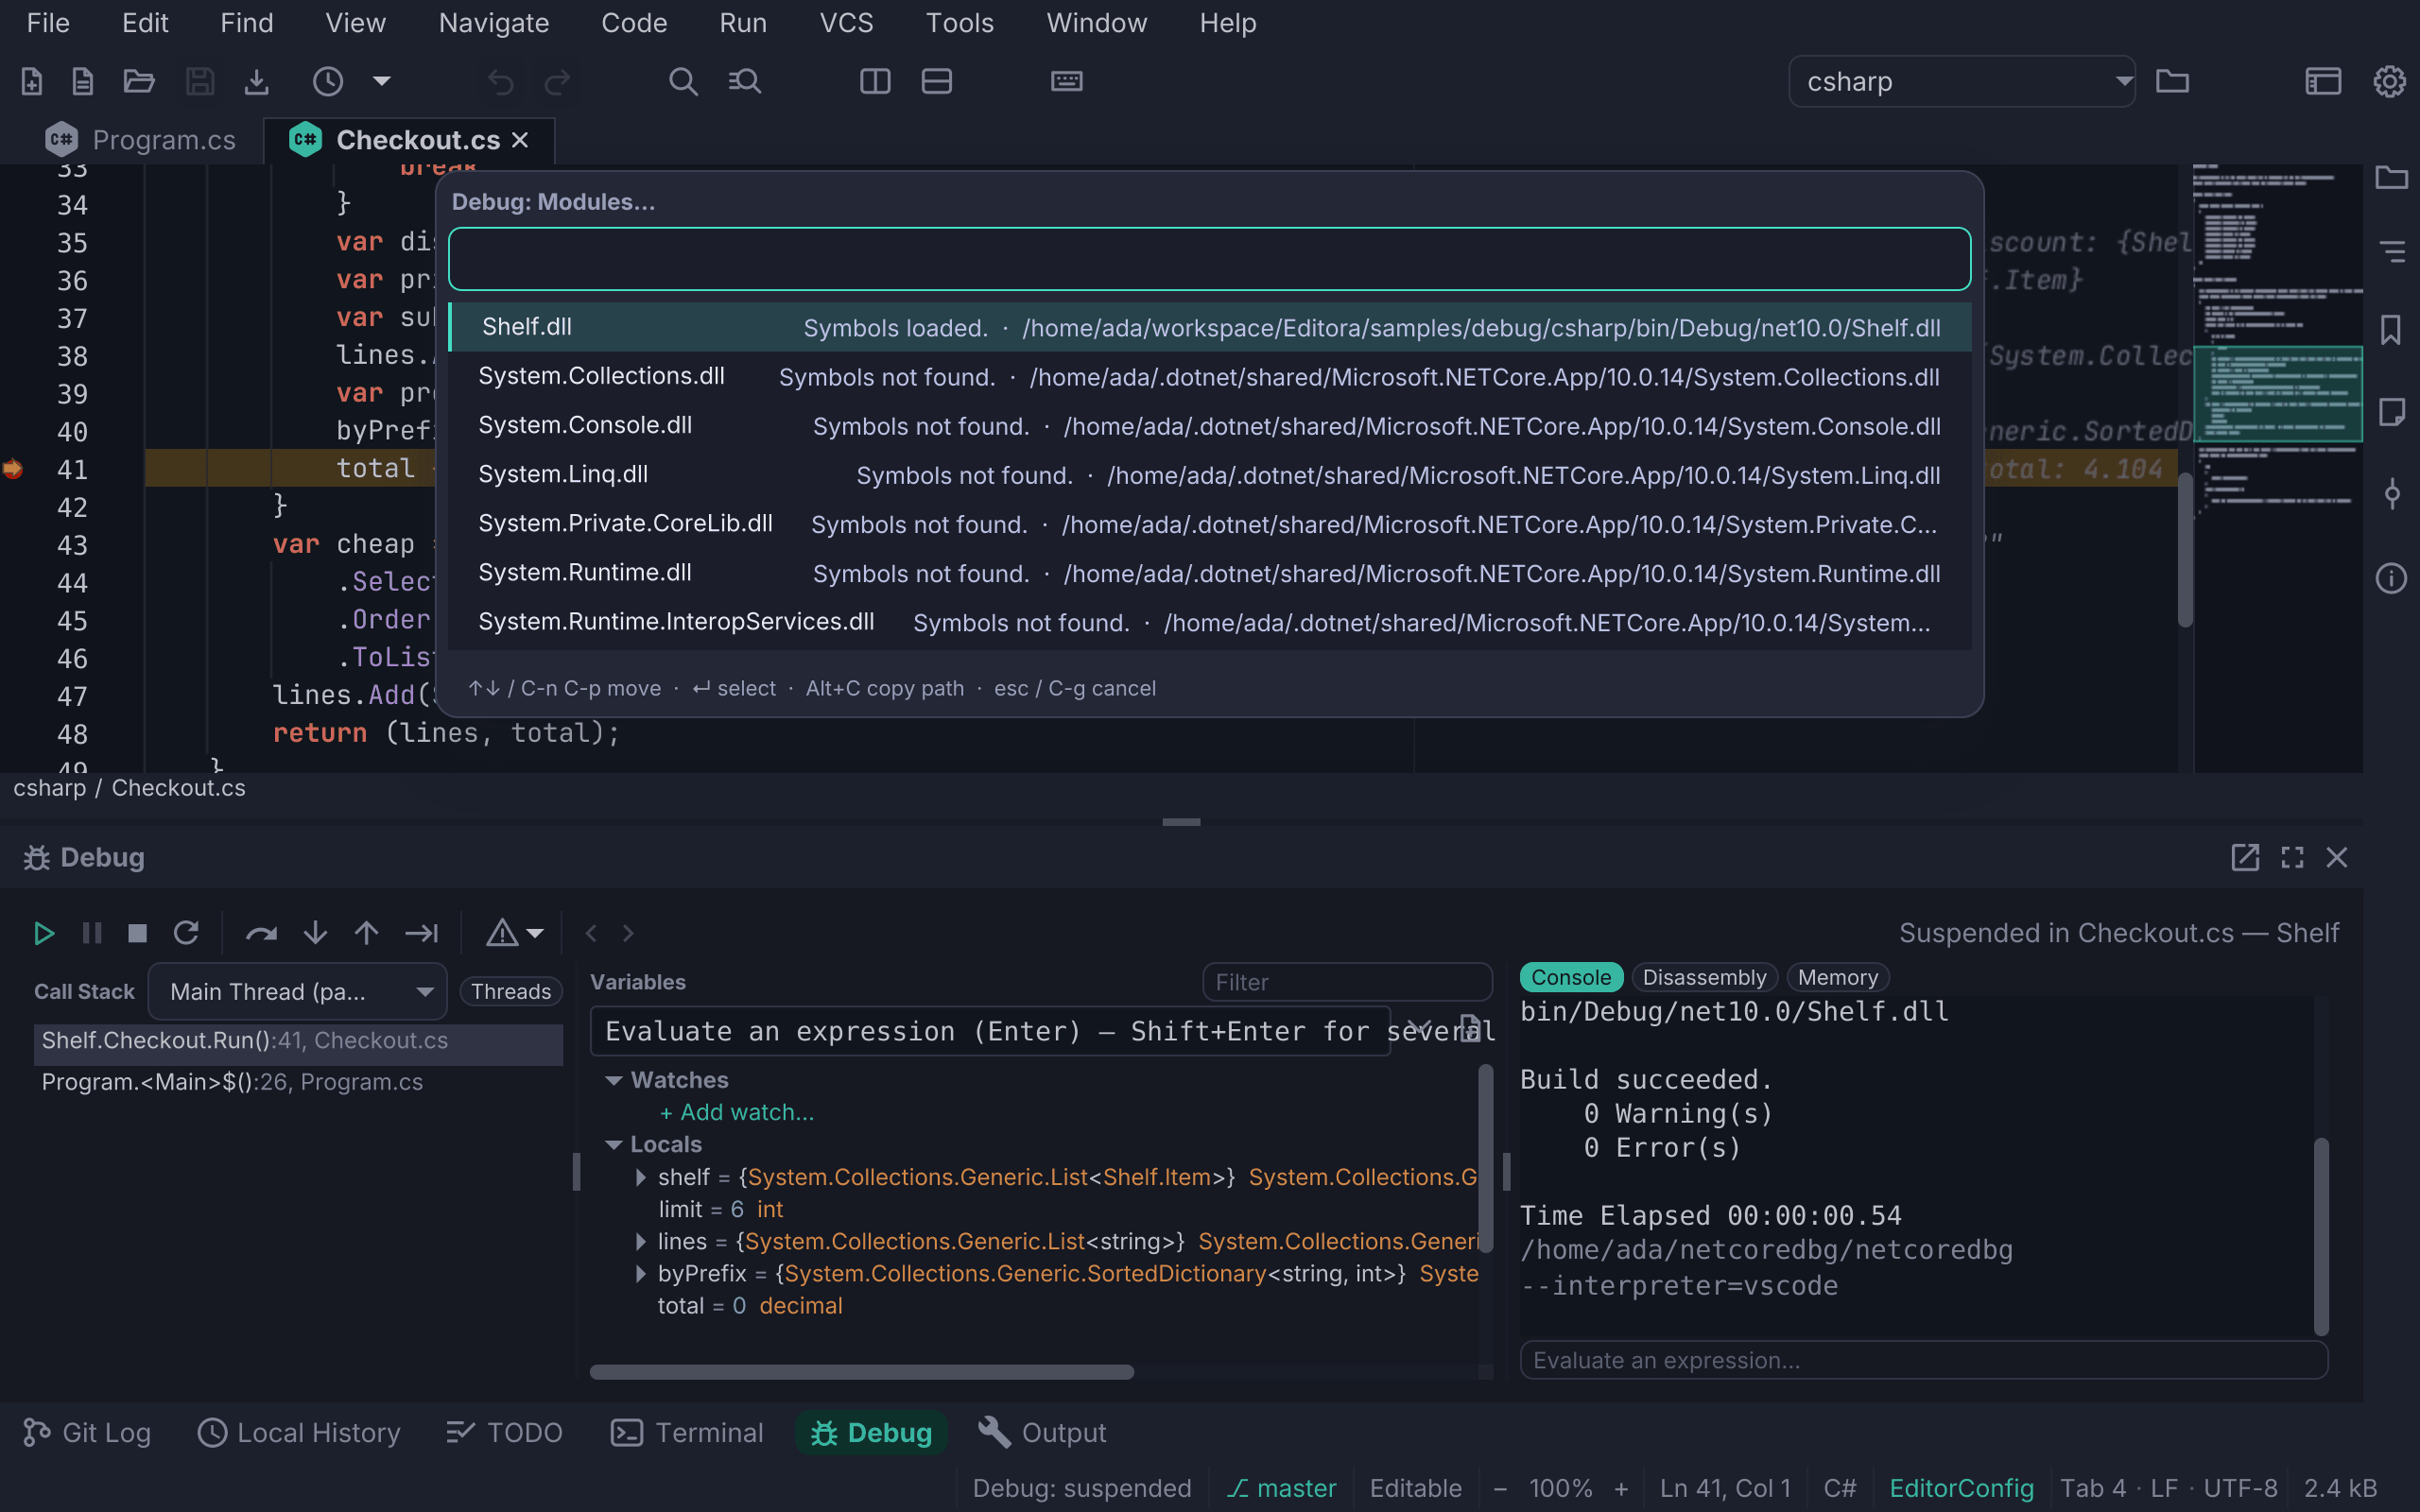
Which list a debugger fills:
| Debugger | Loaded Sources | Modules |
|---|---|---|
| JavaScript and TypeScript (vscode-js-debug) | yes | no |
| Rust, C and C++ (CodeLLDB) | no | yes, with symbol status |
| C# (netcoredbg) | no | yes |
| Python (debugpy) | no | the modules whose code has run under the debugger, such as your script as __main__; not every import |
| Java, Go | no | no |
When the debugger doesn’t fill a list, as Java’s and Go’s fill neither, the command says so in the status bar. The lists follow the program as it runs: a source or module it unloads drops out.
Code without a file
When a JavaScript or TypeScript program stops in, or steps into, code the
debugger holds only in memory, such as code run through eval, that code opens in a read-only tab, named as the debugger names it
(such as <eval>/VM46947589), with the current line marked, as VS Code shows
it. The tab opens once per
session; a later stop in the same code brings it to the front. The call stack
shows such frames like any other, and clicking one opens its code.
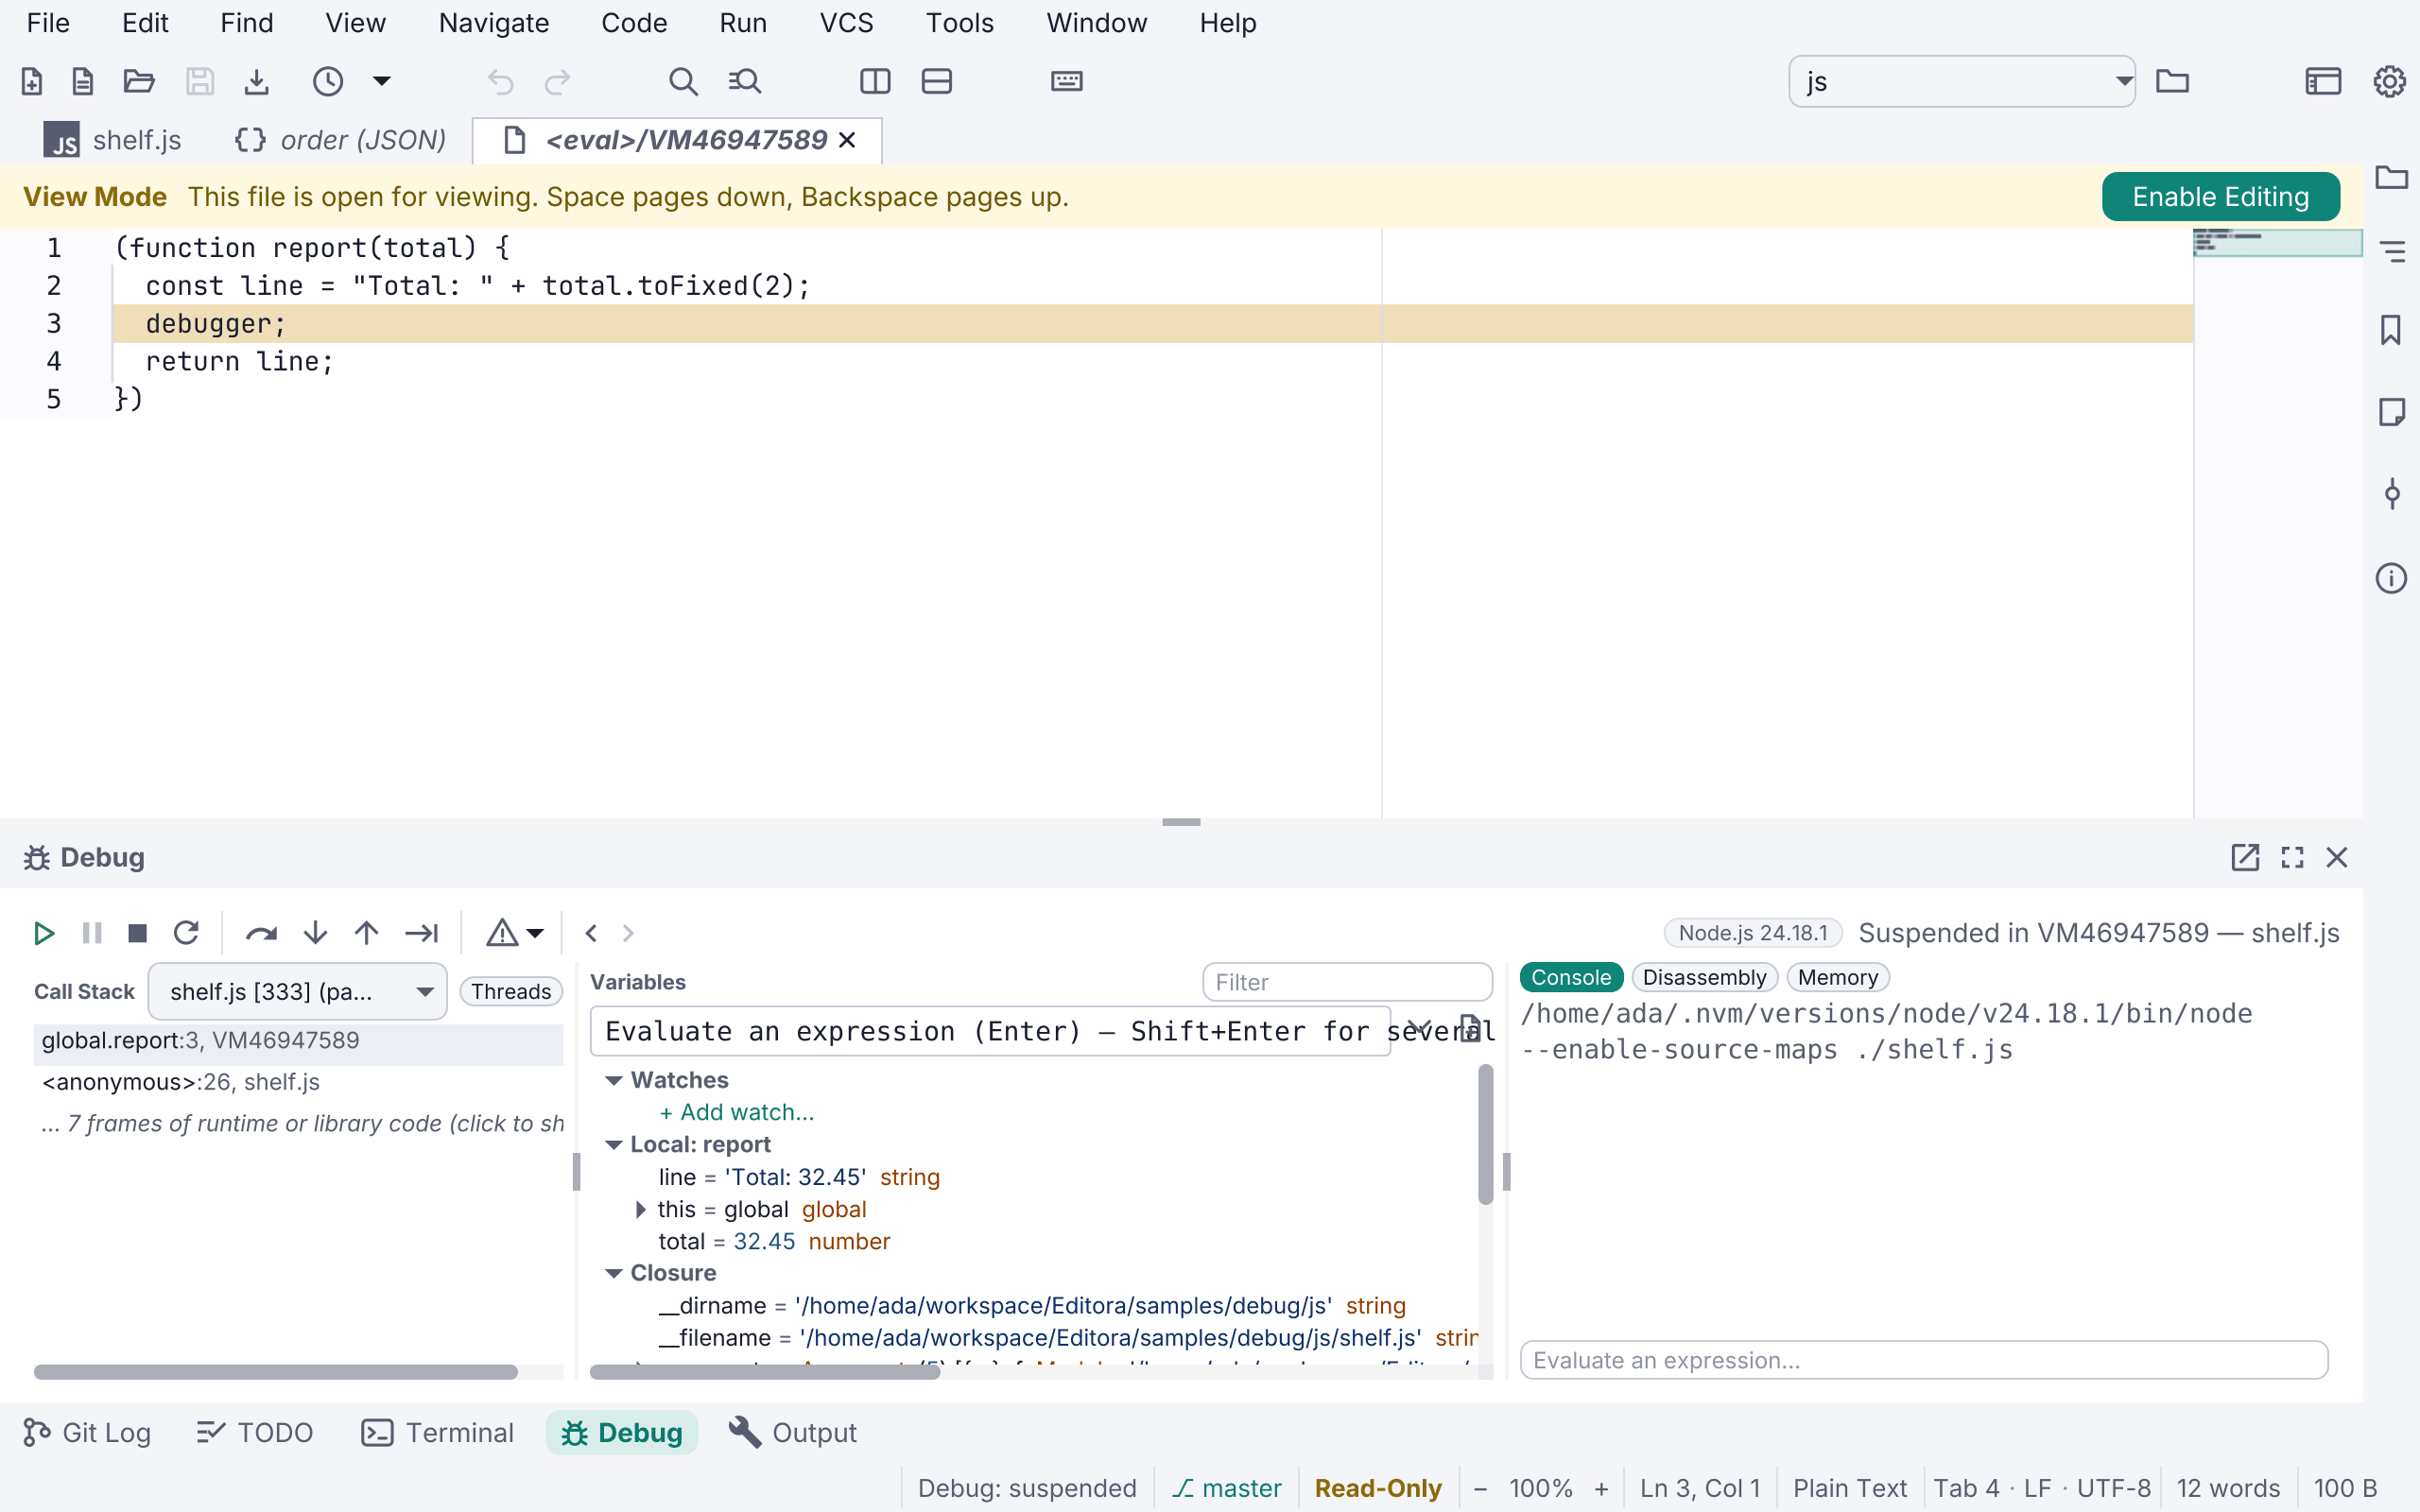
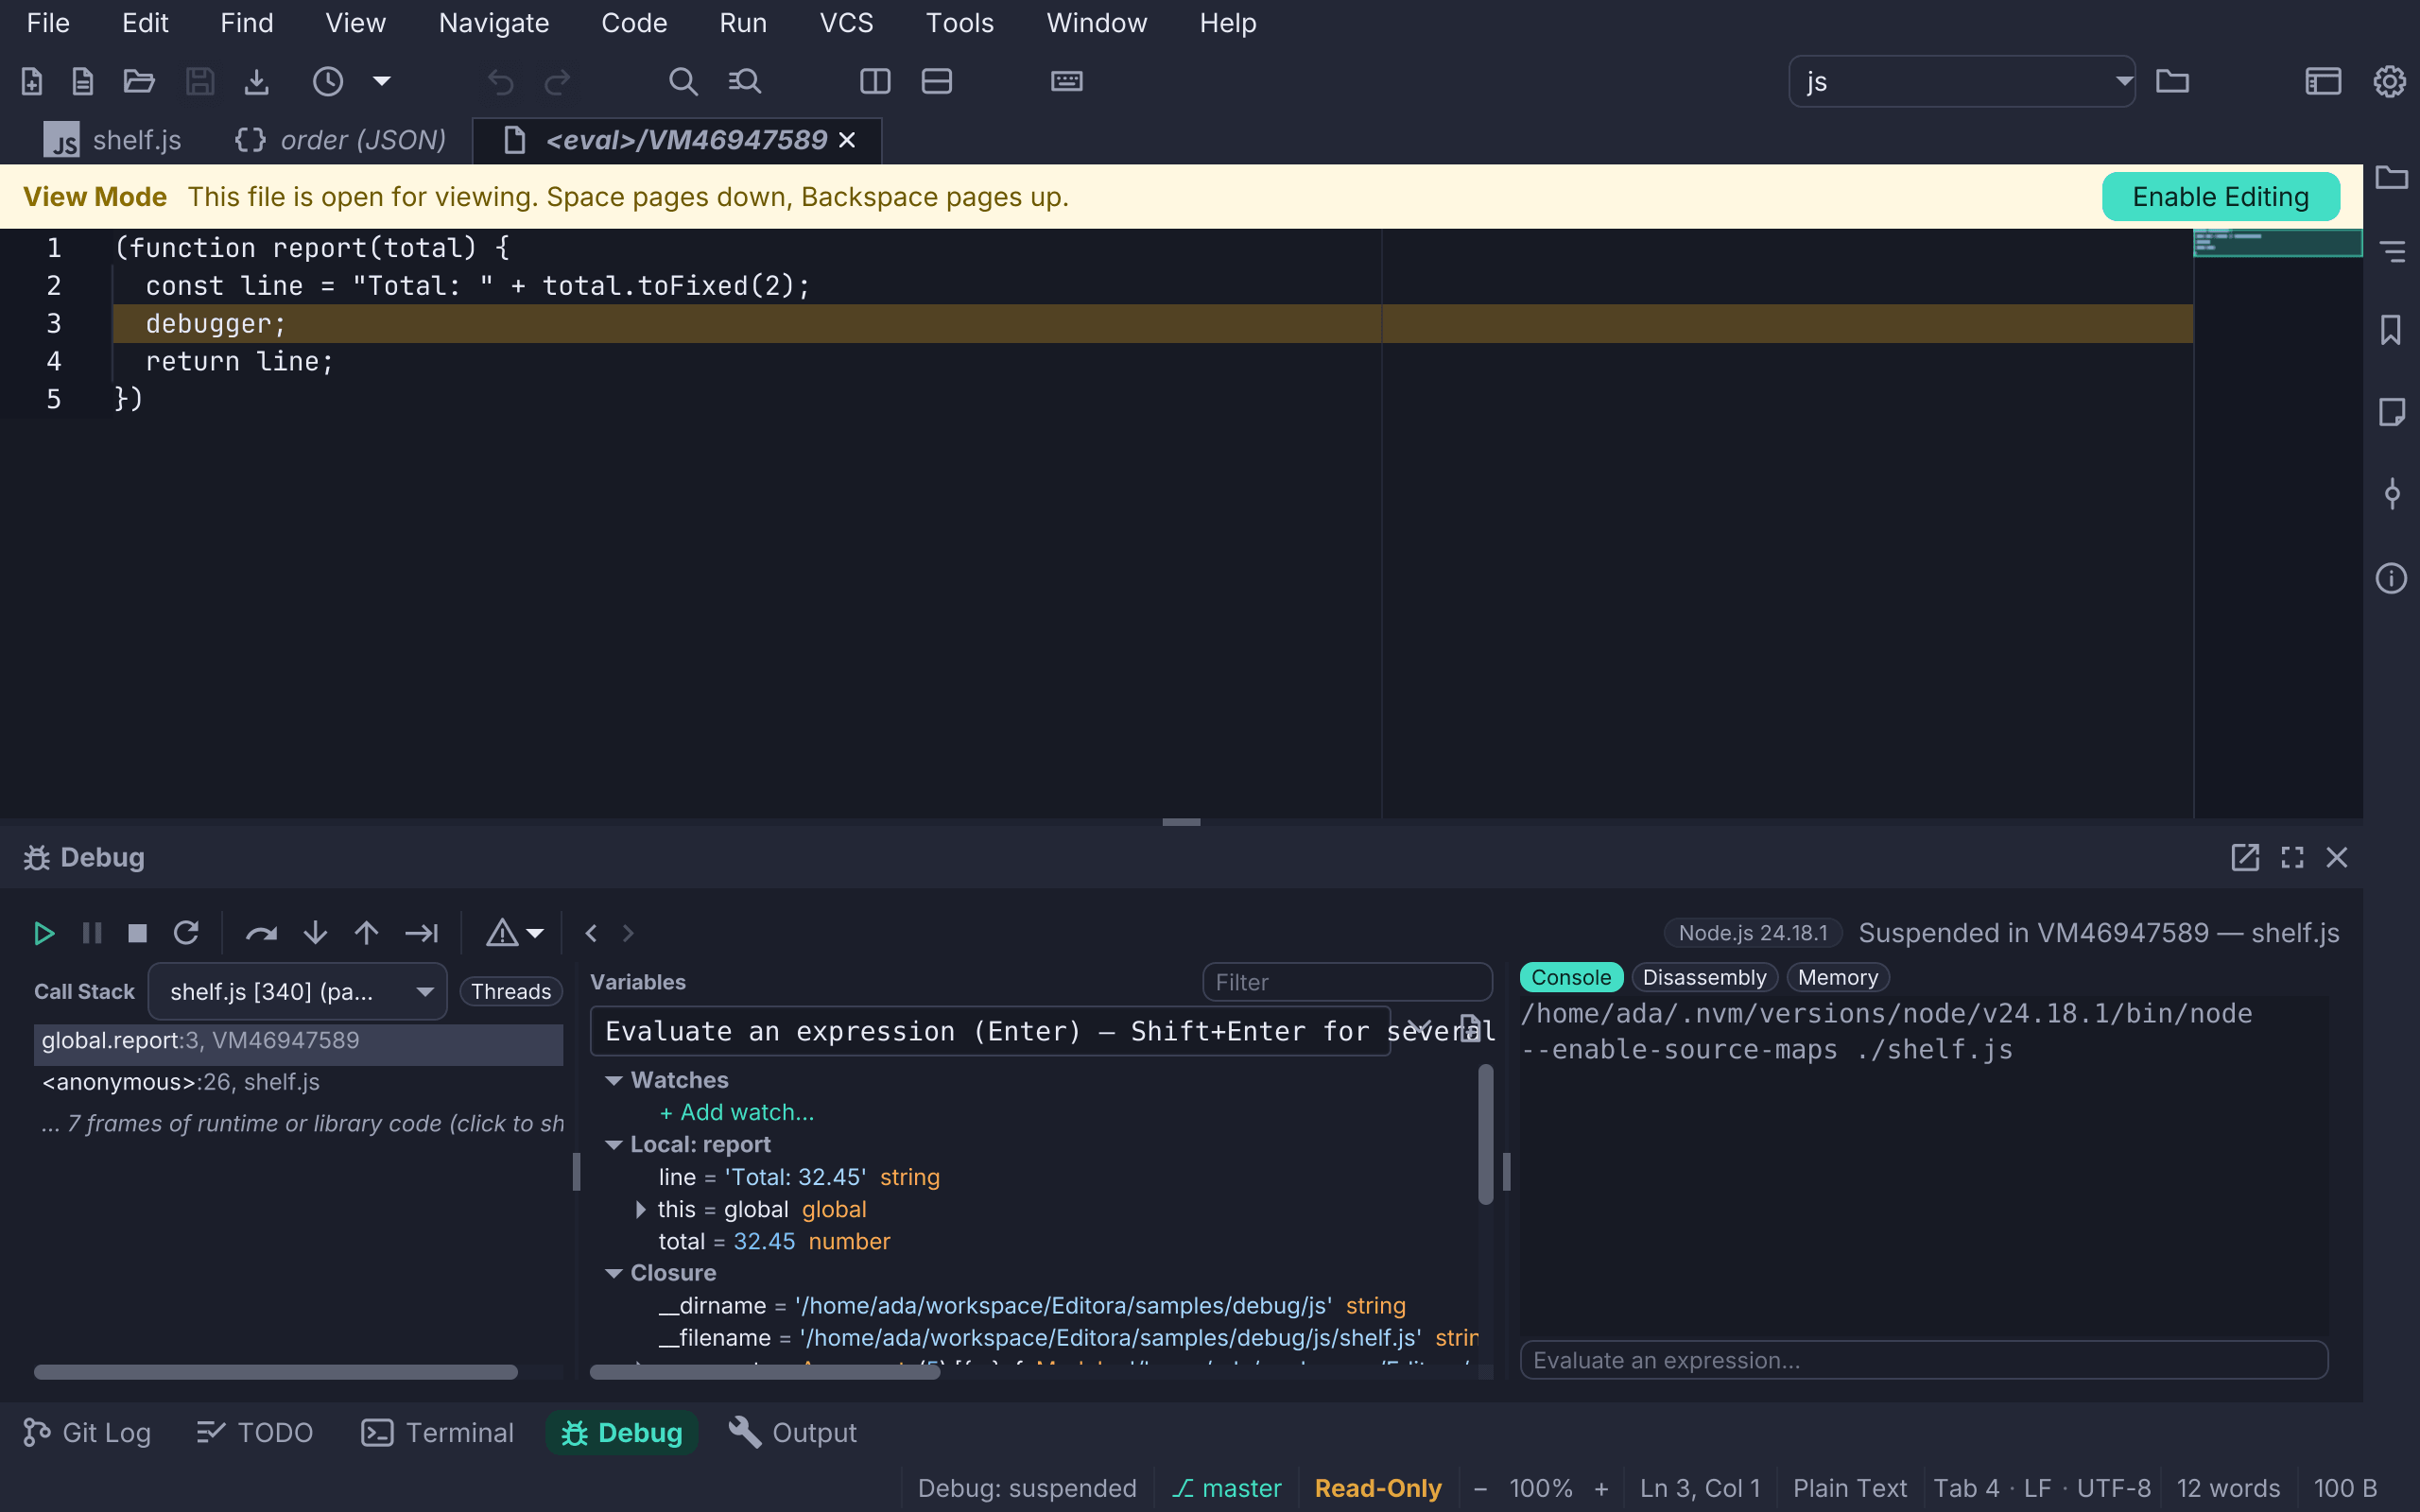
Breakpoints can be set in that tab. They last for that debug session only: they are not saved, and they go when the session ends, because the code exists only in that run of the program.
A pause while the program waits inside Node.js’s own code, in a timer for
example, still shows your own line, not Node.js’s internals. Python’s debugger
leaves code run through exec out of the call stack by default, so in practice
this is for JavaScript and TypeScript. An earlier stop in such code, seen in
Debug History, still says there is no source.
Keys in the Debug window
Starting a session or stopping at a breakpoint never moves the keyboard focus into the Debug window: focus stays in the editor, with the caret on the stopped line. A stop opens the Debug window again if you closed it.
When you click into the Debug window, single keys drive the session, as in gdb:
| Key | Action |
|---|---|
c | Start or continue |
p | Pause |
n | Step over |
s | Step into |
f | Step out (finish) |
u | Run to cursor |
b | Step back |
| Shift+C | Reverse continue |
| Shift+K | Stop |
| Shift+R | Restart |
Stop and Restart need Shift, so a stray k or r typed in a list does nothing
to the program. The keys don’t apply while you type in the evaluate field or
the console’s input field.
Stepping keeps the focus in the Debug window, so you can step again and again.
A toolbar button’s tooltip shows both its key in your keymap and its key in the
Debug window, for example “Step Over (F10 · in this window: N)”.
Debug via the build tool
Some applications are meant to be started by the build tool rather than by a bare
java command. Debug: Debug via Build Tool (debug.viaBuild) launches the
app under a suspended JVM through Gradle (run or bootRun) or, for a Spring
Boot Maven project, spring-boot:run with a JDWP agent. Editora
watches the build output for the JDWP banner and attaches the debugger when the
app is listening. It complements Debug Main Class, which uses the language
server; a plain Maven main has no uniform build-tool debug mechanism, so use
Debug Main Class there. Two cases are called out in the status bar: a
spring-boot-maven-plugin whose configuration sets its own <jvmArguments>
replaces the debug agent Editora passes, so the launch warns up front, and a
build still running after 45 seconds with no banner says the app may have
started without the agent and points at Debug Main Class or the plugin’s
configuration.
For Debug Test and Debug via Build Tool, in
Maven and in Gradle, every JVM the build starts listens on a free port, so a
busy port 5005 does not get in the way. Gradle and spring-boot:run print the
JDWP banner, which Editora reads for the port. A Maven test JVM is different:
Surefire 3 prints that banner only after the test has run, so Editora picks
the port itself, passes it in -Dmaven.surefire.debug and attaches as soon as
the fork listens; the one “Debugger failed to attach: handshake failed” line
the JVM prints is Editora’s port check, not an error. For Gradle, Editora
passes an init script that adds the debug agent to
the test, run or bootRun task. A Gradle build that runs on another
machine uses --debug-jvm and its fixed port 5005 instead. When a run starts
several JVMs, for example forked test JVMs, Editora attaches to each in turn,
as the session before it ends. Stop on
such a session also ends the test or build run that started the JVM, with any
JVMs still waiting.
Debugging Groovy
Groovy is debugged by a debugger built into Editora, so there is nothing to install. Debug on a Groovy file runs it as Run does, and Debug on a Groovy script run configuration uses that configuration’s script, arguments, folder, environment, JDK and VM arguments.
- Breakpoints work in scripts, classes and closures.
- Stepping goes from line to line of your code and steps over Groovy’s own runtime, which sits between nearly every two calls a script makes.
- Variables show the frame’s locals,
this, and the fields of any object or the elements of an array. A closure’s frame is named after the method it is in, such asReport.run { closure }. - Hover and Watch read a variable or a field path such as
order.total. They never call a method, so looking cannot change the program. - Exceptions: an exception that leaves your code uncaught stops where it was thrown. This is on by default for Groovy; Break on Caught Exceptions also stops on exceptions your own code catches. Exceptions Groovy throws and catches inside its runtime never stop.
Not supported yet: conditions, hit counts and log messages on a breakpoint (such a breakpoint shows hollow and says so), evaluating expressions or method calls, hot code replace, and debugging on a remote host or in a container.
Debugging Kotlin
Kotlin is debugged by a debugger built into Editora, so there is nothing to install beyond the Kotlin compiler. Debug on a Kotlin file runs it as Run does, compiling a program first, and Debug on a Kotlin run configuration uses that configuration’s file, arguments, folder, environment, JDK and VM arguments.
- Breakpoints work in programs, scripts and lambdas, whether or not the file sits in a folder named after its package.
- Frames are named as Kotlin names them:
Hello.mainfor a top-level function inHello.kt, andHello.main { lambda }for a lambda inside it. - Stepping goes from line to line of your code and steps over the Kotlin standard library and the coroutines machinery.
- Variables show the frame’s locals,
this, and the fields of any object or the elements of an array. Hover and Watch read a variable or a field path; they never call a method. - Exceptions: an exception that leaves your code uncaught stops where it is thrown, on by default; Break on Caught Exceptions also stops on exceptions your code catches.
For a Gradle project, open a Kotlin file and use
Debug via Build Tool: Gradle starts the app under
a suspended JVM and Editora’s Kotlin debugger attaches to it, so breakpoints in
.kt files bind. Debug: Attach to Running Program… (debug.attach) from a Kotlin file attaches the same
way to any JVM listening for a debugger.
Not supported yet: conditions, hit counts and log messages on a breakpoint (such a breakpoint shows hollow and says so), evaluating expressions or method calls, hot code replace, and debugging on a remote host or in a container.
Debugging Clojure
Clojure is debugged by the same built-in debugger as Groovy, with nothing to install. Debug on a Clojure file runs it as Run does, under the Clojure CLI or Leiningen, and Debug on a Clojure script run configuration uses that configuration’s file, arguments, folder, environment, JDK and VM arguments.
- Breakpoints work in a namespace’s functions and in a script’s top-level
forms. Clojure compiles
src/my_app/core.cljto classes that namecore.cljas their source, which is how a breakpoint finds them. - Stepping goes from line to line of your code and steps over Clojure’s
runtime and
clojure.core. - Frames are named as Clojure names the function, such as
my-app.core/greet(not the classmy_app.core$greet). - Variables show a frame’s locals, kept alive for the whole function during
a session (
clojure.compiler.disable-locals-clearing), so a local still reads after its last use. A value shows as its class, such asPersistentVector; expand it for its fields. Nothing in the program is called to print it. - Exceptions: an exception that leaves your code uncaught stops where it was thrown, on by default as for Groovy.
Babashka scripts can’t be debugged: bb is a native program, with no JVM for
the debugger to attach to. Debug says so and runs nothing; run the script, or
debug the same code under the Clojure CLI.
The debugger sees the classes your files were compiled to when the program loaded them. A function you redefine from a REPL is compiled again to a new class, so a breakpoint set before the redefinition does not stop in it, and code evaluated in a REPL has no file to stop in. Breakpoint conditions and log messages, evaluating expressions, and debugging on a remote host are not supported yet, as for Groovy.
Debugging Scala
A file of an sbt, Mill, Gradle or Maven build is debugged by Metals, which has imported the build: Debug asks Metals to compile the file’s build target and start its debug adapter, which runs the program on the build’s classpath. Metals needs to be installed, running for the file, and done importing the build; otherwise Debug says so. The first session waits for the compile.
A .sc script, a file outside any build, and a Scala CLI project are debugged
by a debugger built into Editora, so there is nothing to install: the program
runs with Scala CLI as Run runs it, with the debugger’s agent passed as a
--java-opt. Breakpoints bind by file name, since a Scala file’s package does
not have to match its folder. Stepping skips the standard library
(scala.runtime, the collections, Predef). A lambda’s frame reads
Main { lambda }, a top-level definition’s Main.greet, and an object’s
methods Util.twice. Locals, this and fields are shown without running any
code in the program. Conditional breakpoints and logpoints are not supported
there yet.
Debugging Go
Go is debugged with Delve, the debugger
VS Code’s Go extension uses. Debug a Go file with Debug: Start / Continue
(debug.start, F5 in the VS Code, CUA and Sublime Text keymaps), or with
Debug File in the editor’s right-click menu:
- A file of a module (a
go.modin its folder or above) debugs its package, asgo run .runs it. - A file outside any module is debugged alone, as
go run file.goruns it. - In a
_test.gofile, Debug and Debug Test at Caret (test.debugAtCaret) run the test function the caret is in on its own (aBenchmark…function runs alone as a benchmark), and every test of the package when the caret is outside a test function.
Restart runs the same program or test again, wherever the caret is by
then. The arguments set by File: Run with Arguments… (file.runWithArgs)
are passed to the program, or to the test binary.
Delve builds the program itself, with optimizations off, using the go that the
Go build tool runs. It builds from the files on disk, so
Debug and Restart save the package’s edited Go files first. Its build goes to
the temporary folder, so no __debug_bin file is left in your package. The
program’s output reaches the Debug console.
- Breakpoints take conditions, hit counts and log messages. A line that holds only a comment takes none.
- Stepping, Variables, Watches, hover values and inline values work. A struct, slice or map unfolds to its fields or items.
- Goroutines are threads. The call stack’s thread list and the
Threads view name each one, such as
[Go 6] main.restock.func1. Delve lists at most 1024 goroutines. See Goroutines for which are listed. - A panic stops the program where it happened. Delve does that by itself, so Go has no exception breakpoints to choose.
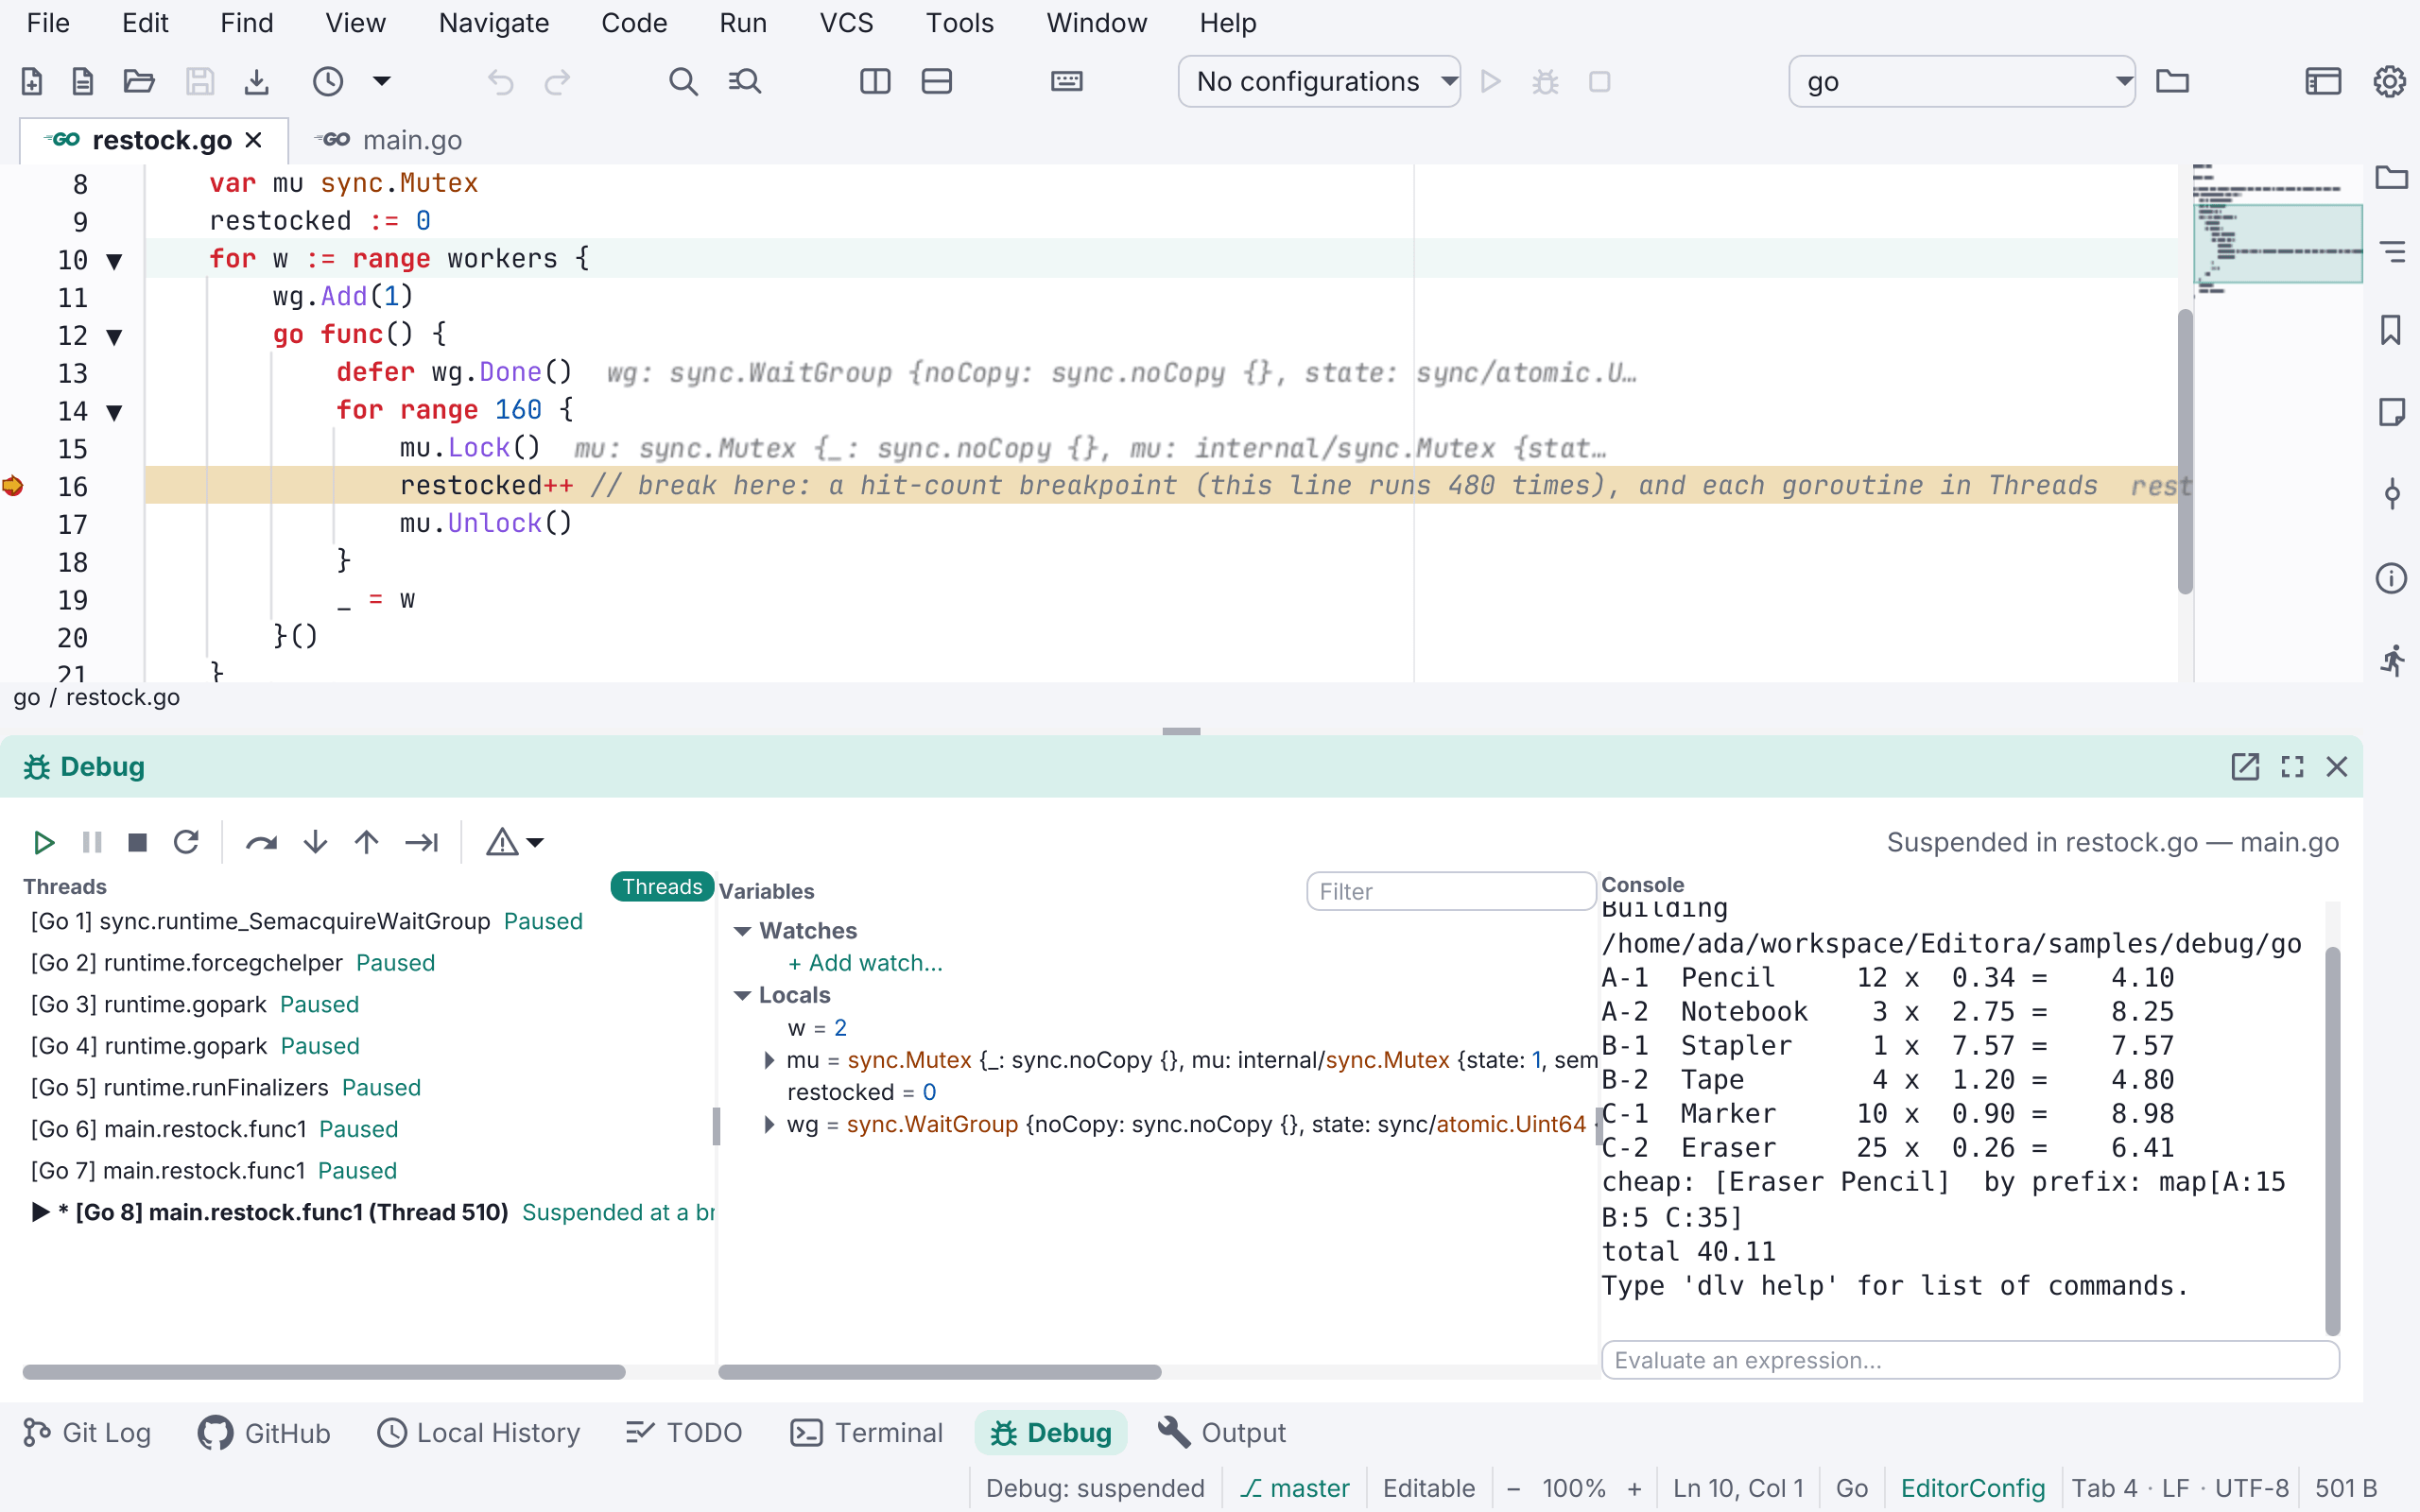
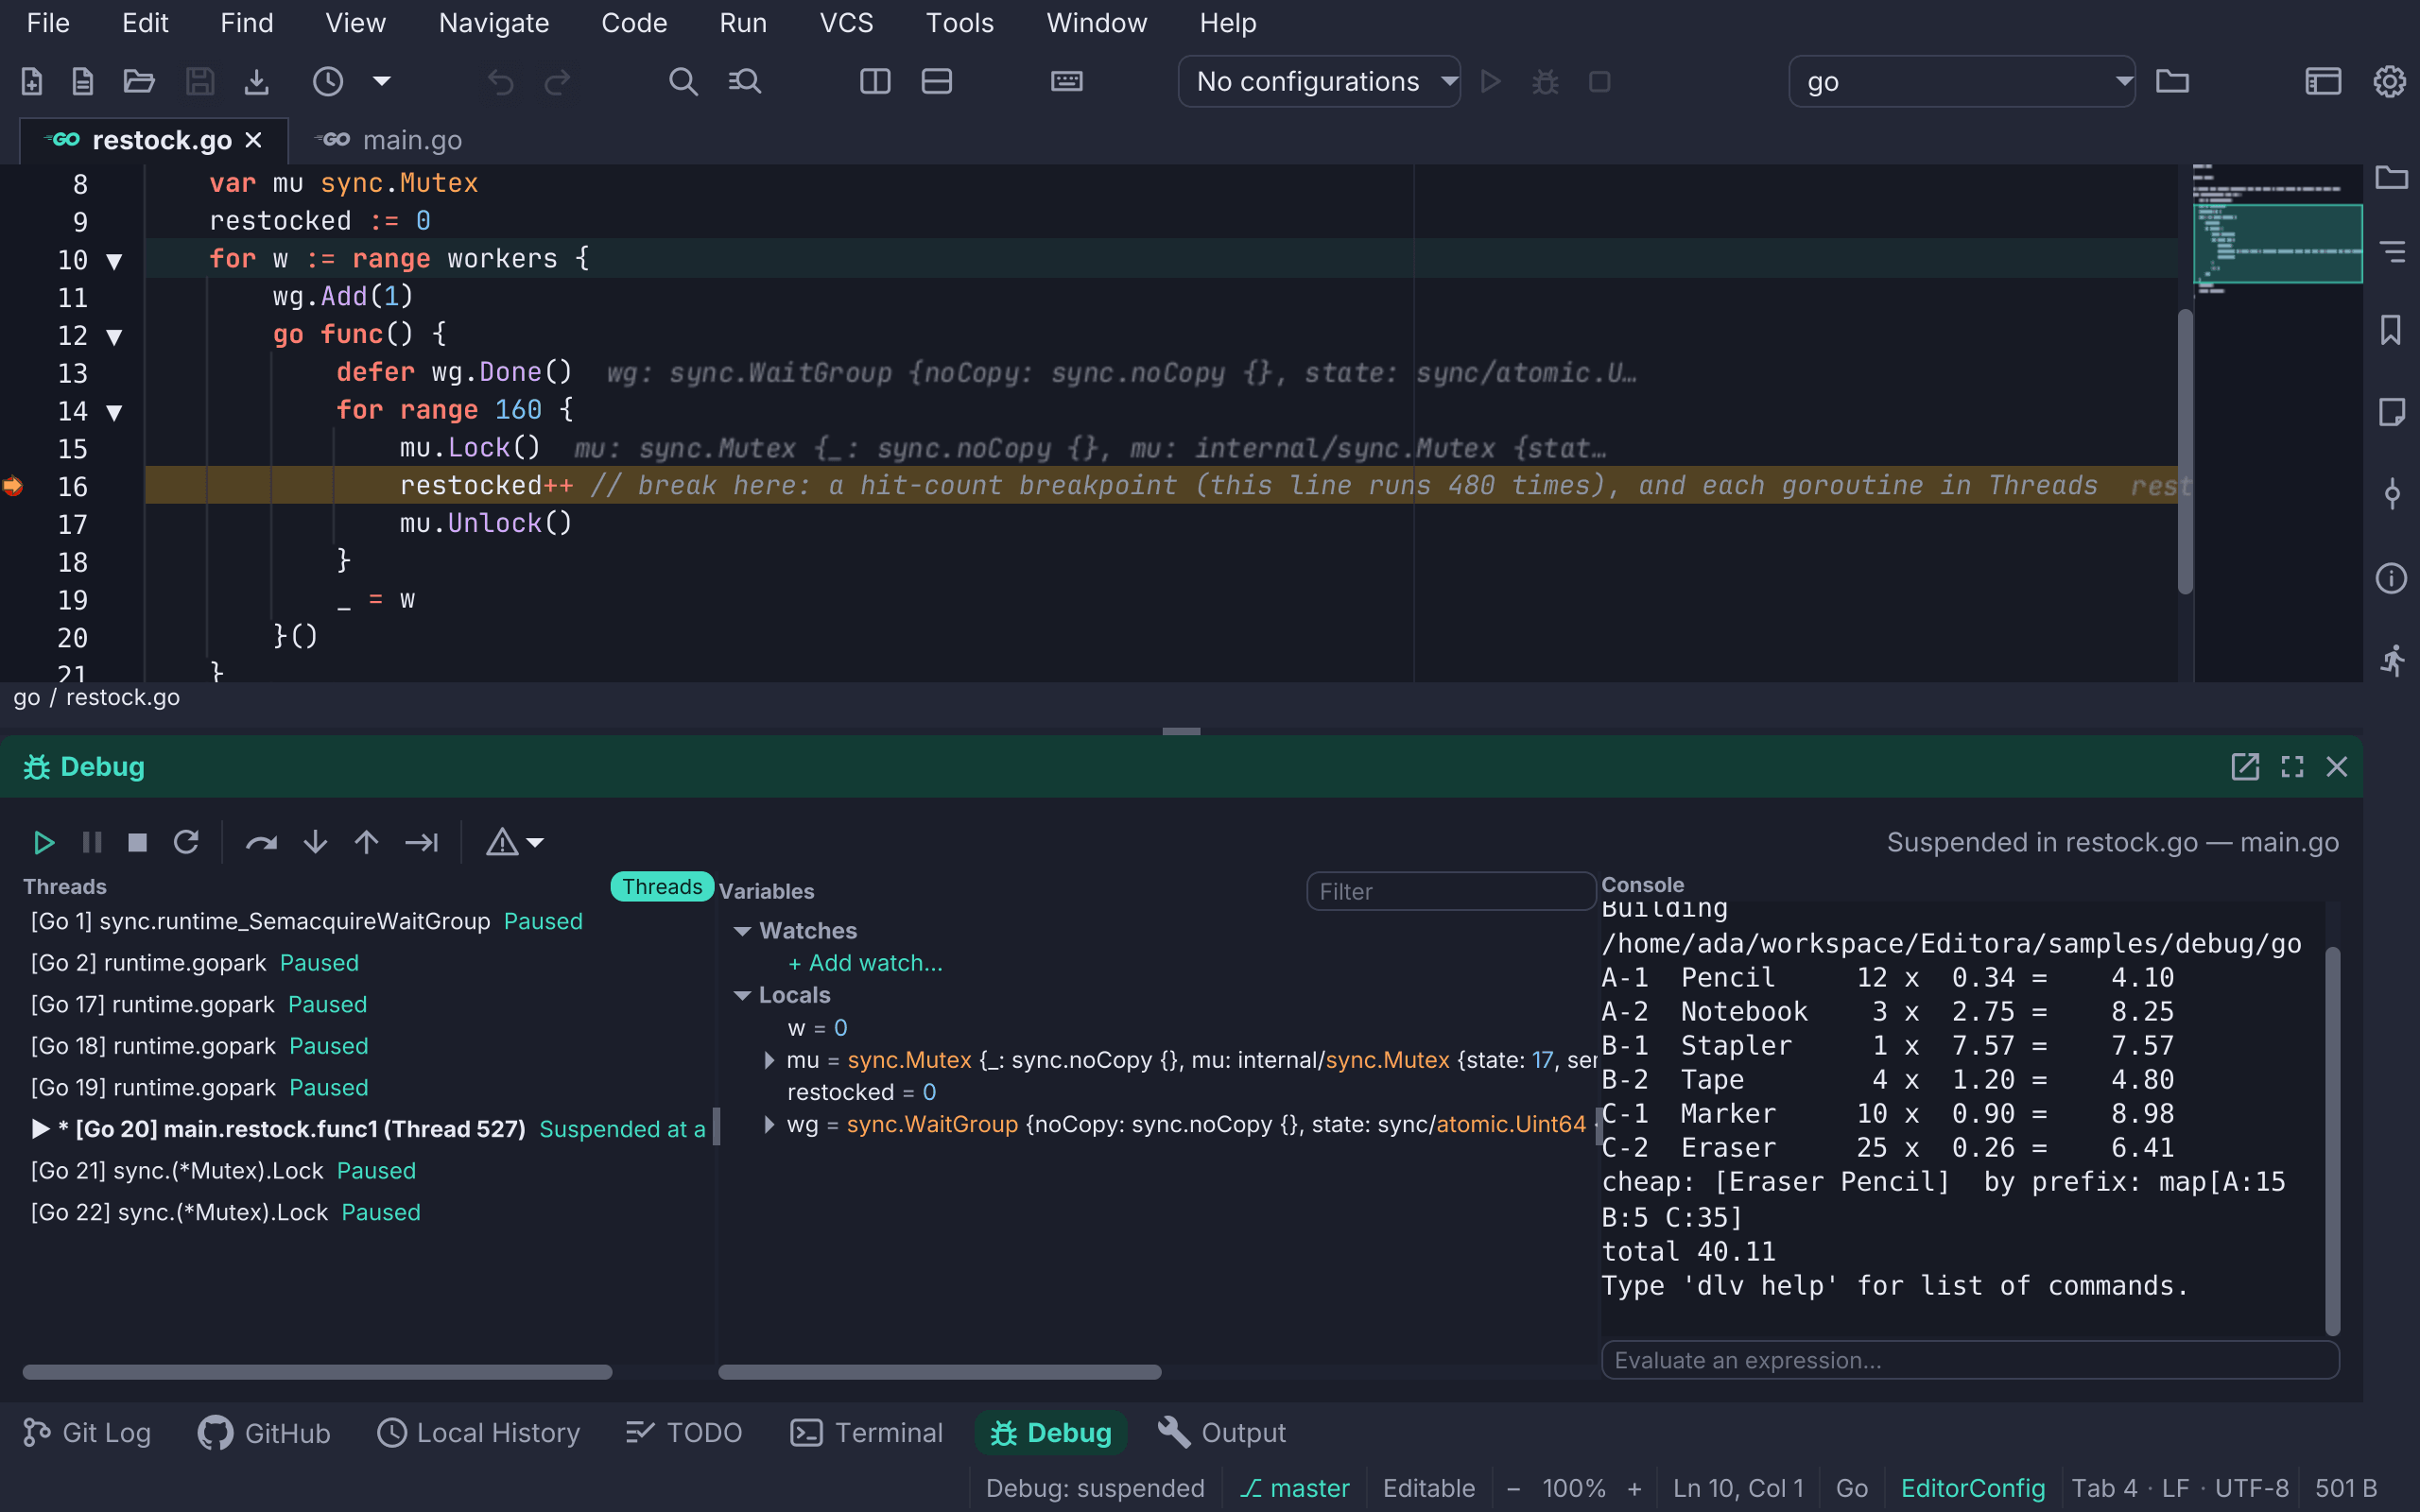
Attach to Process attaches Delve to a Go program that is already running, on Linux and macOS. Stop leaves that program running. Open Core Dump opens the core a crashed Go program left in Delve.
Goroutines
The Threads view lists your program’s goroutines. The runtime’s own, such as
the garbage collector’s workers, the finalizer and the scavenger, are left out.
A goroutine started under pprof labels (pprof.Do) shows them in its name:
[Go 20 job:resize-0] main.worker.
Right-click the Threads view for:
- Hide Runtime Goroutines (
debug.toggleRuntimeGoroutines): untick it to list the runtime’s goroutines again. - Filter Goroutines… (
debug.filterGoroutines): list only the goroutines that Delve’s own filter keeps, such as-with label job=*,-without go runtime.*or-with user. Empty lists every goroutine.
Both apply to the running program at once and are kept. A filter can leave out the goroutine the program stopped on.
Go goroutines in Settings → Debugging holds the same choices:
Hide runtime goroutines (on), pprof labels in names (* for every
label, or the keys to show, such as job, region; empty shows none, from the
next session on) and Goroutine filter.
Delve isn’t bundled. Editora finds dlv as set on the Go (Delve) card of
Settings → Debugging, else on the PATH, else where go install puts it
($GOBIN, $GOPATH/bin or ~/go/bin), so a Delve installed while Editora runs
is found too. The card’s Install… runs
go install github.com/go-delve/delve/cmd/dlv@latest, which needs Go. Without
Delve, Debug says Delve (dlv) was not found and how to get it. The card’s
switch, Enable Go debugging (Delve), is on by default, and the
Doctor checks for Delve.
Debugging Rust
Rust is debugged with CodeLLDB, LLDB
with Rust’s formatters, as VS Code debugs it with rust-analyzer. A Rust file is
debugged from its Cargo package, the nearest Cargo.toml above it; outside a
package, Debug says so. Debug: Start / Continue (debug.start, F5), or
Debug File in the editor’s right-click menu, debugs, depending on where the
caret is:
- in a
#[test]function (or#[tokio::test]and the like): that test alone, in its test binary. Debug Test at Caret (test.debugAtCaret) does the same. - in an integration test file (
tests/*.rs), outside a test: all its tests. - in a file of
examples/: that example. - anywhere else: the package’s program. In a library with no program, the file’s tests.
Cargo builds first, in the Debug console, after Editora saves the package’s
edited Rust files. A build runs the build.rs scripts and procedural macros of
the package and its dependencies, so the first one in a folder asks you to
trust the folder, as a Cargo task does;
declining builds nothing. Stop ends the build, and a build that fails launches
nothing. CodeLLDB then debugs the program or test binary Cargo built, with the
arguments set by File: Run with Arguments…. Restart builds and runs
the same program or test again.
- Values show as Rust values: a
Stringor a&strreads as its text, and aVecor aHashMapunfolds to its items. - A panic stops the program where it happened: the Rust: on panic exception breakpoint is on by default.
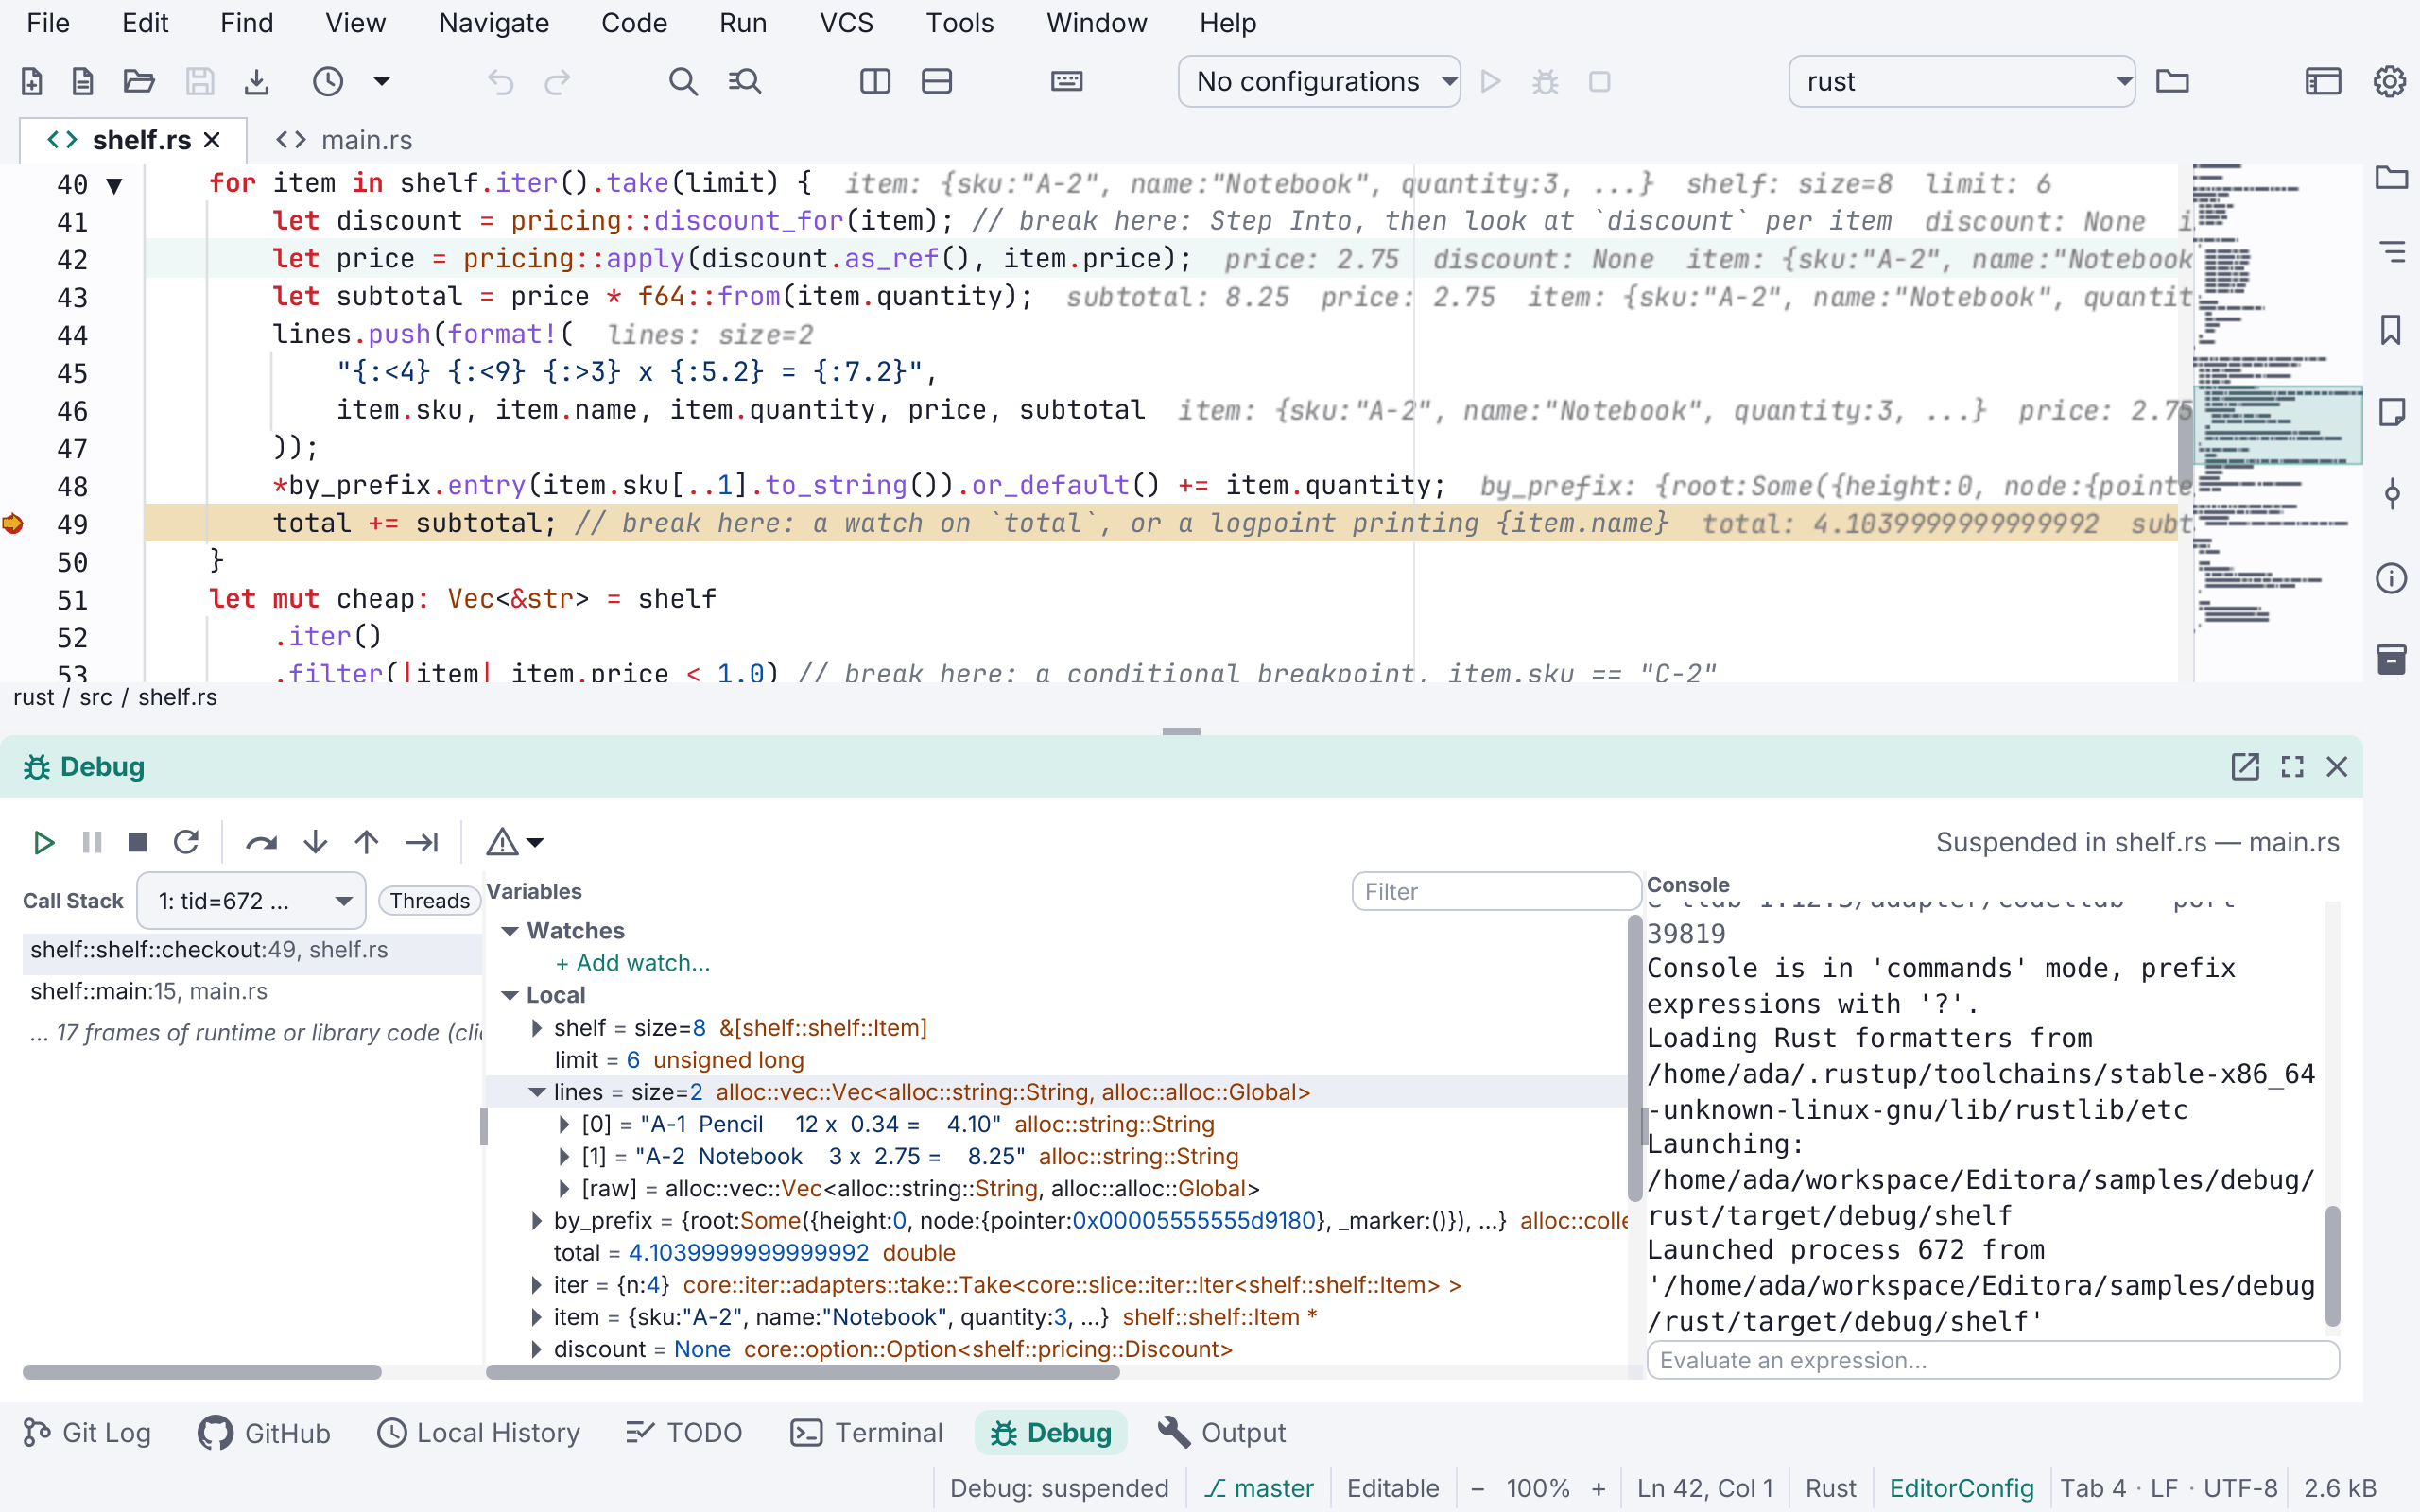
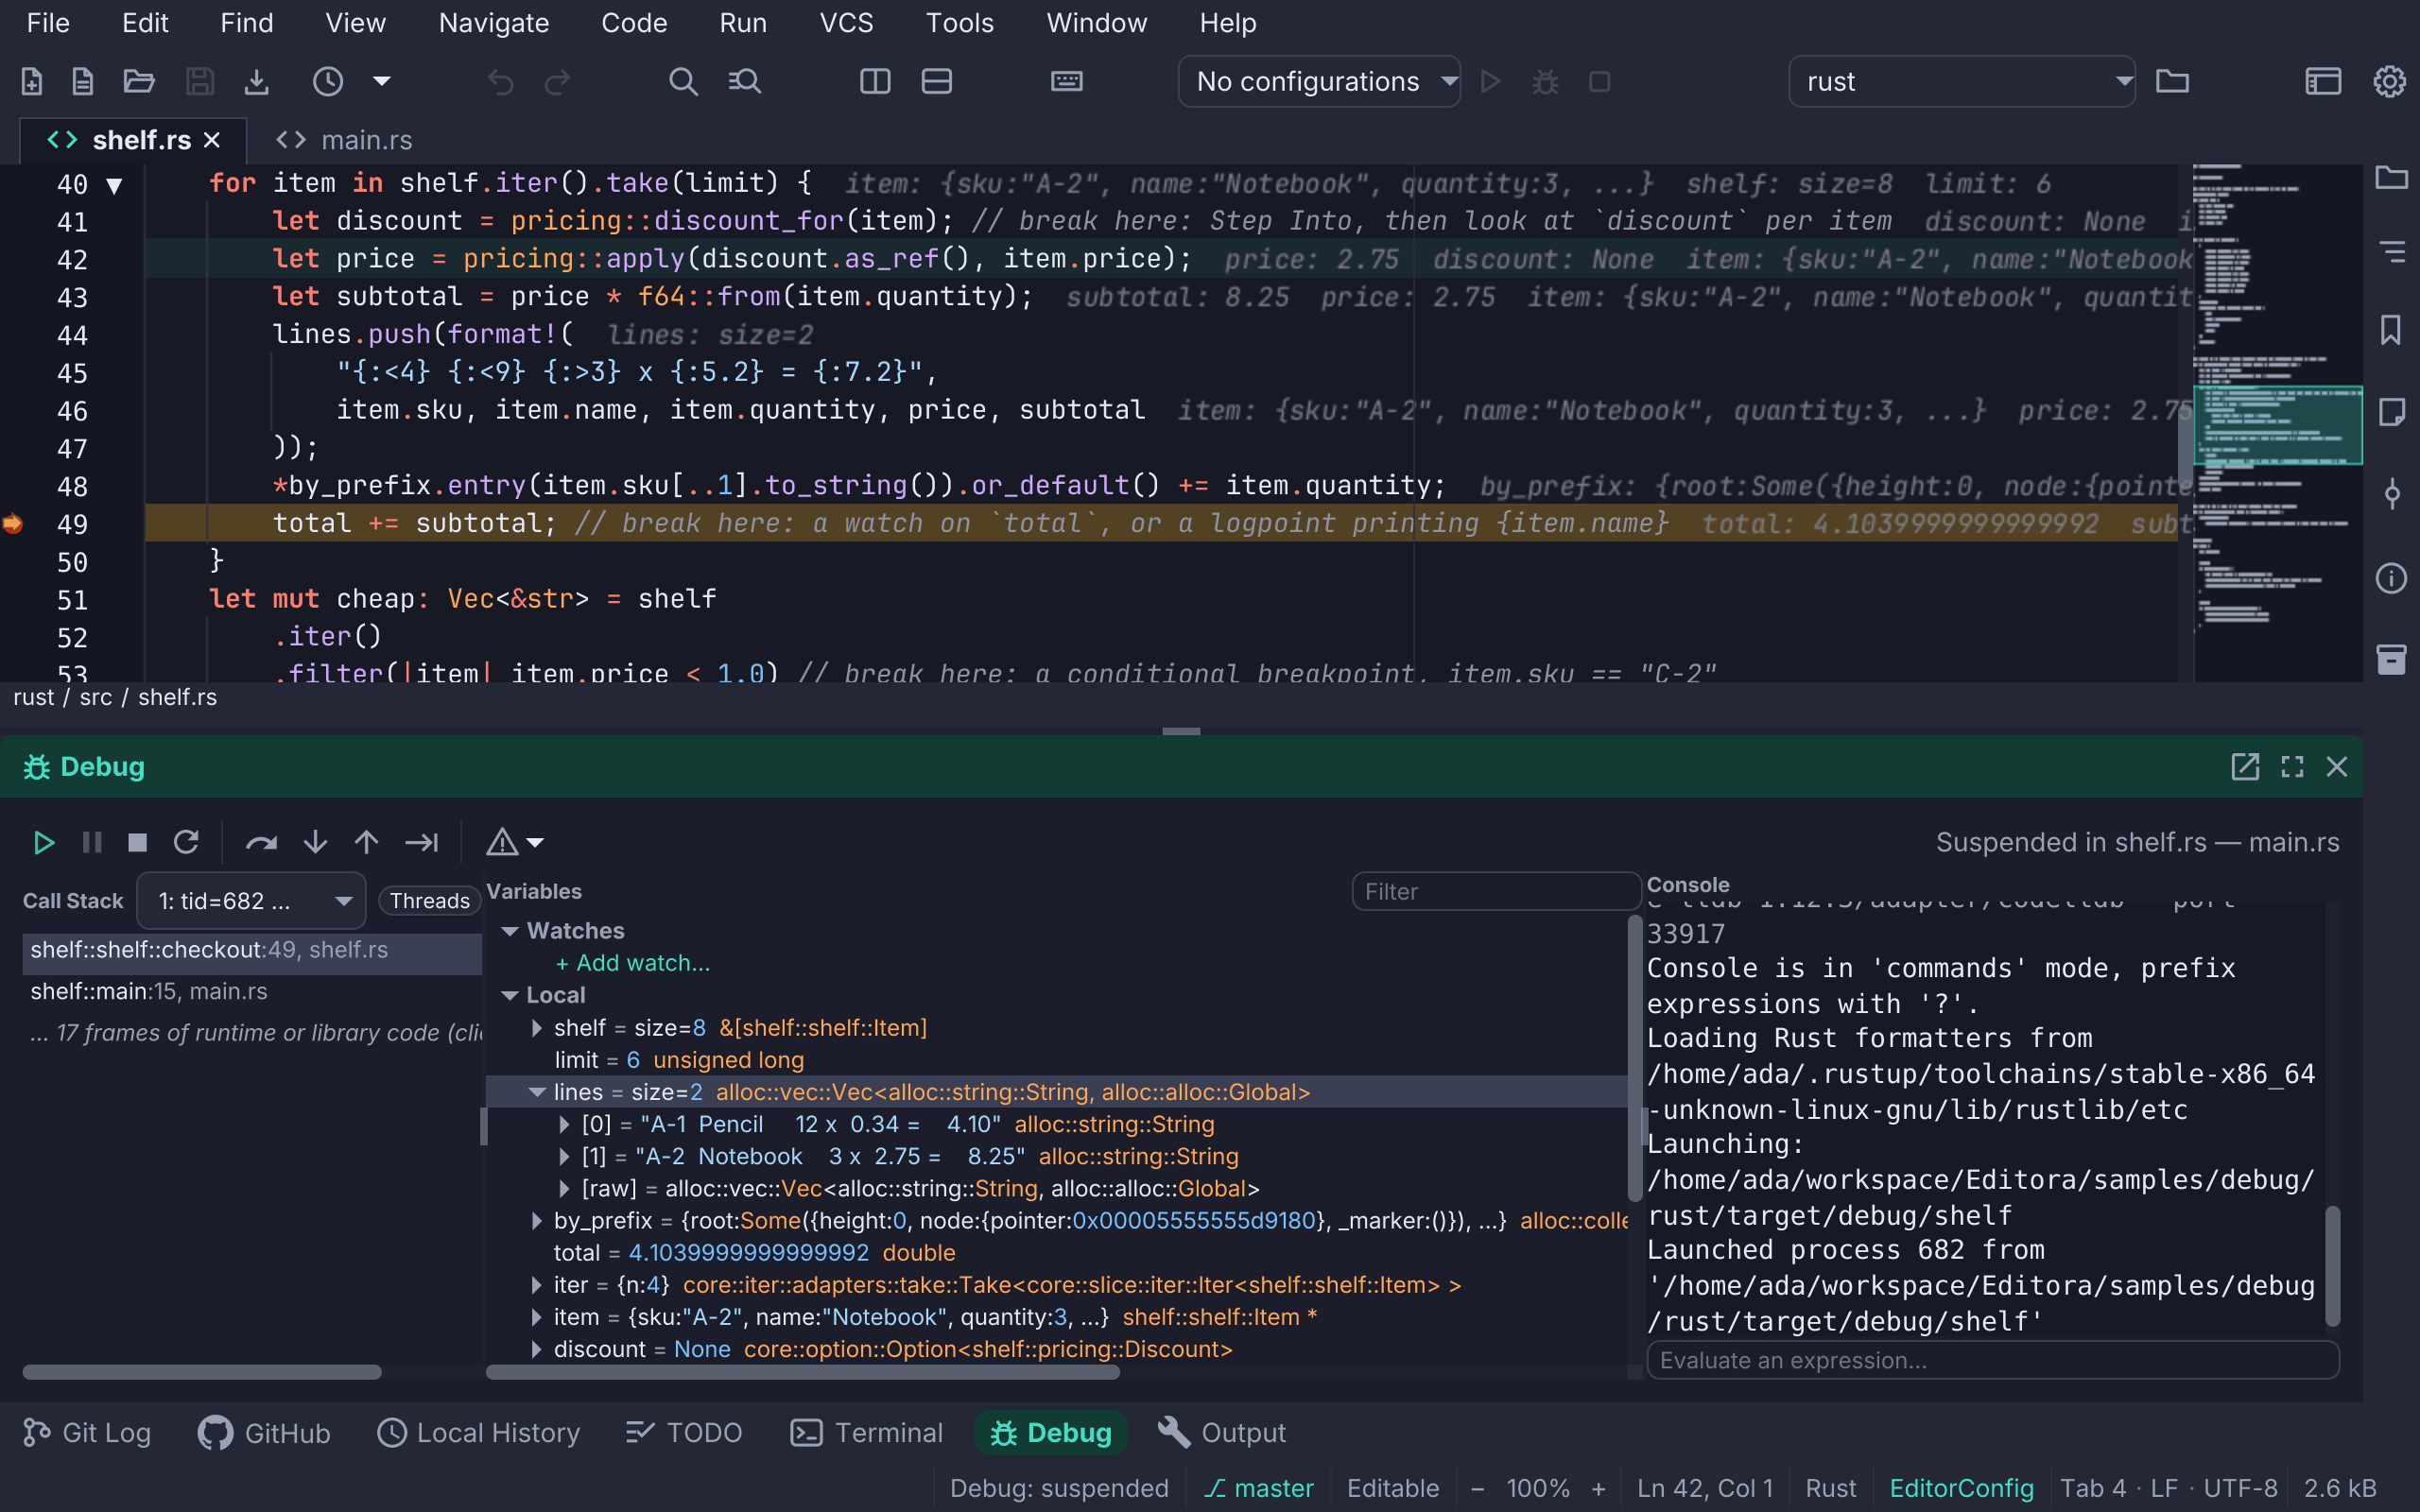
- Breakpoints take conditions, hit counts and log messages, and stepping, Watches and the Threads view work.
- With program input on, Editora starts the program for CodeLLDB, so the program reads lines typed in the Debug console.
- The Disassembly and Memory views show the program’s machine code and memory, and step by instruction.
Attach to Process attaches CodeLLDB to a Rust program that is already running, on Linux, when it was built with debug information. Stop leaves that program running. Open Core Dump opens the core a crashed Rust program left in CodeLLDB.
CodeLLDB isn’t bundled. Editora finds it as set on the Rust, C and C++
(CodeLLDB) card of Settings → Debugging (the codelldb program, or the
folder of an unpacked CodeLLDB extension), else in its own install, else in
VS Code’s CodeLLDB extension (vadimcn.vscode-lldb), else on the PATH. The
card’s Install… downloads CodeLLDB 1.12.3, the release tested with Editora,
for Linux, macOS or Windows, checks its SHA-256 checksum, and unpacks it into
your config folder. Cargo and Rust come from rustup; Editora doesn’t install
them. The card’s switch, Enable Rust debugging (CodeLLDB), is on by
default, and the Doctor checks for CodeLLDB.
Debugging C and C++
C and C++ are debugged with the same CodeLLDB as Rust, or
with GDB if you choose it. Debug: Start / Continue (debug.start, F5) or
Debug File in the editor’s right-click menu builds the program first, in
the Debug console, after Editora saves the project’s edited C and C++ files:
- In a CMake project (a
CMakeLists.txtin the file’s folder or above), it configures a Debug build inbuild/editora-debugand builds it, then debugs the program whose sources hold the file, else the project’s only program. - In a Make project (the nearest makefile above the file), it runs
makein that folder, then debugs the program it built: the one named after the file, in the folder or in itsbin/orbuild/, else the only one, else the newest. - A file outside a project is compiled with
cc, orc++for C++, with-g -O0, into Editora’s cache folder. A header outside a project says to open its source file instead.
CMake and Make run the project’s own code, so the first build asks you to
trust the folder, as Maven and Cargo do. A
lone file compiled with cc asks nothing. A build that fails launches nothing.
Restart builds again, and the arguments set by File: Run with
Arguments… are passed to the program.
- Values:
std::stringreads as its text, andstd::vectorandstd::mapunfold to their items. - A thrown C++ exception stops the program where it was thrown: the C++: on throw exception breakpoint is on by default.
- Breakpoints, stepping, Watches, the Threads view and the Disassembly and Memory views work.
Attach to Process lists running C and C++ programs built with debug information, on Linux, and attaches CodeLLDB to the one you pick. Open Core Dump opens a crashed program’s core in CodeLLDB. With GDB, Record Execution lets you step backward through what the program just did.
The Rust, C and C++ (CodeLLDB) card of Settings → Debugging has the
switch Enable C and C++ debugging (CodeLLDB), on by default, and C and
C++ debugger, which picks CodeLLDB or GDB. GDB debugs through its own
Debug Adapter Protocol mode (gdb -i dap), which needs GDB 14 or later. Editora
finds gdb as set in GDB path on the same card, else on the PATH; without
it, Debug says GDB was not found. GDB isn’t installed by Editora.
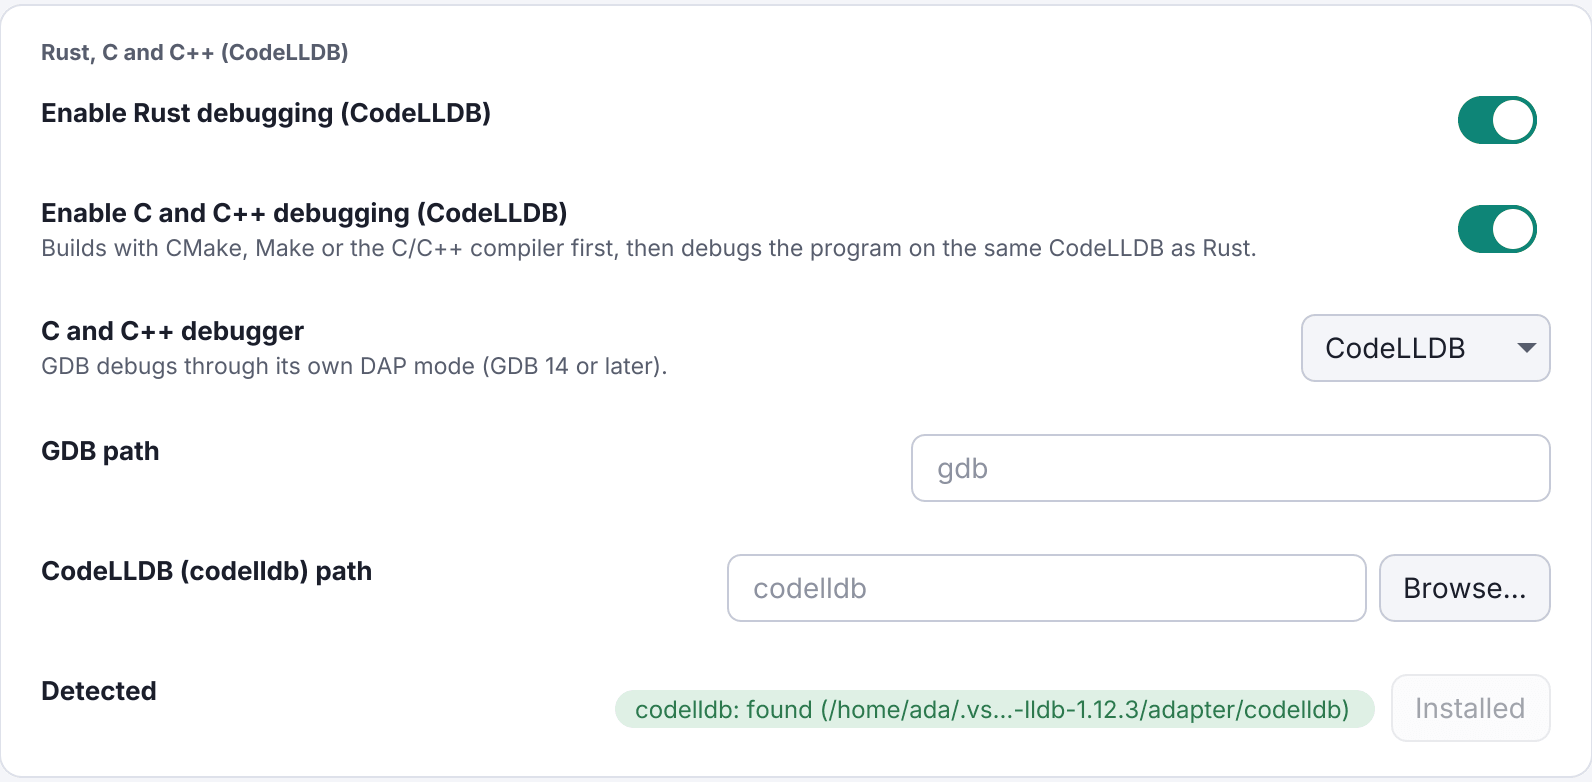
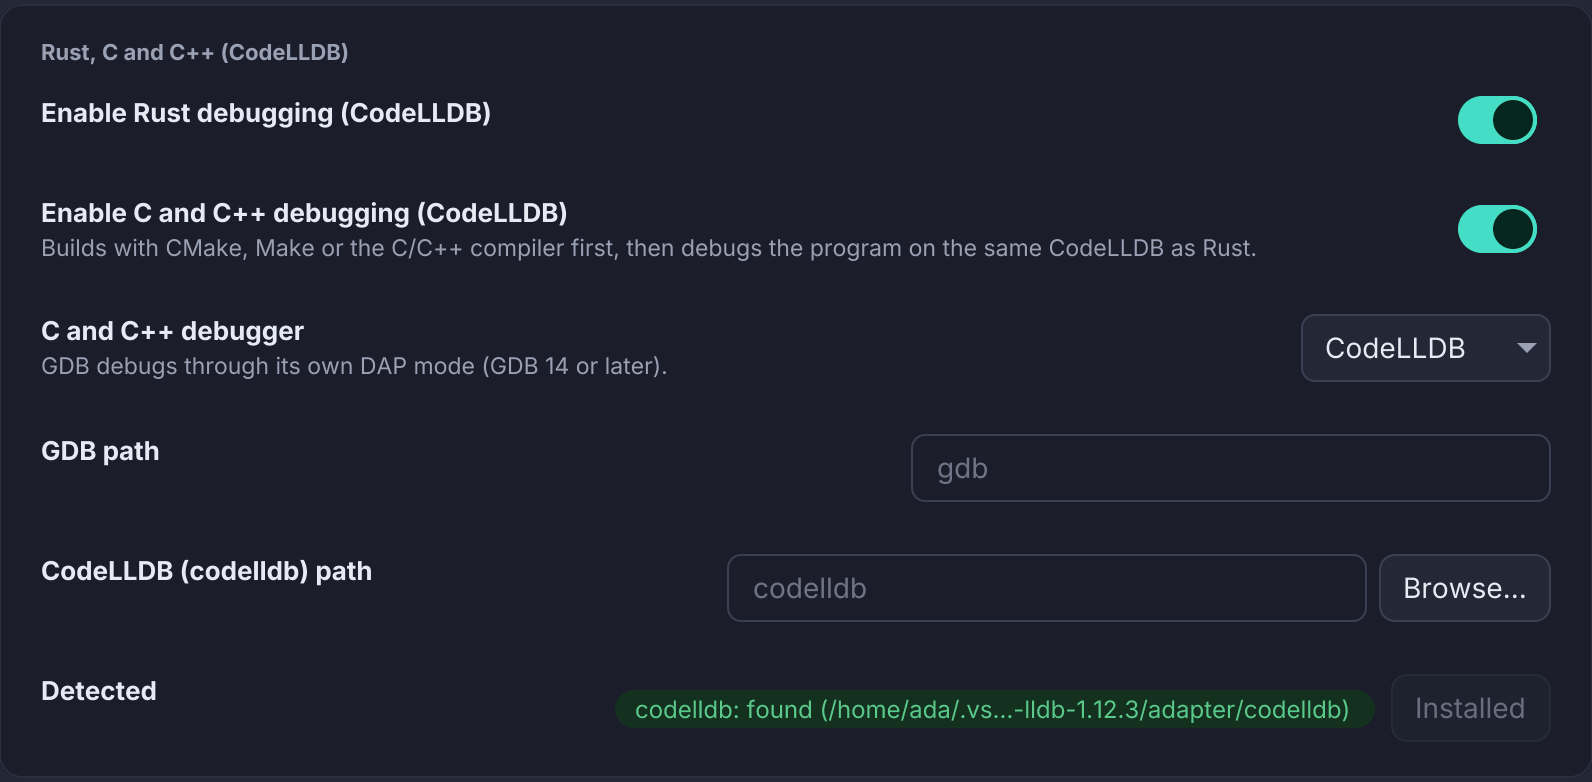
Debugging C#
C# is debugged with netcoredbg, the
open-source .NET debugger. Debug: Start / Continue (debug.start, F5) or
Debug File in the editor’s right-click menu builds the program with
dotnet build in the Debug console, after Editora saves the project’s edited
C# files, then debugs it:
- In a project, the nearest
.csprojin the file’s folder or above it (of several, the one named after the folder) is built. MSBuild runs the project’s own build steps, so the first build asks you to trust the folder. - A lone
.csfile is built and debugged as a .NET 10 file-based app. The SDK’s build of it reads theDirectory.Build.propsandDirectory.Build.targetsof the folders above it, which are code too, so it asks for the same trust first.
Declining the trust question builds and runs nothing. The program runs on dotnet in the project’s folder, with the arguments set by
File: Run with Arguments…; its output reaches the Debug console. An
exception your code does not handle stops it, as in Visual Studio: the C#:
user-unhandled exceptions exception breakpoint is on
by default, and C#: all exceptions stops on every throw.
netcoredbg doesn’t log logpoints itself, so Editora logs them: the program pauses briefly at each hit while the message is written in the Debug console.
Debug Test at Caret (test.debugAtCaret) in a test project (one that uses
Microsoft.NET.Test.Sdk, xUnit, NUnit or MSTest) runs the test the caret is
in, or every test of its class when the caret is in the class but in no test,
under dotnet test in the Debug console. The test host waits for a debugger,
netcoredbg attaches to it, and the test runs under the debugger, so its
breakpoints stop with the test’s values. A test is a method marked [Fact],
[Theory], [Test], [TestCase], [TestMethod] or [DataTestMethod], also
in a nested test class. The project is built as above, after the same trust
question. Stop ends the dotnet test run, and so does closing the
session’s tab or the window, or an attach that fails; Restart runs the same
test again.
Attaching to a running .NET program isn’t offered; a
launch.json coreclr configuration can attach
by process id.
netcoredbg isn’t bundled. Editora finds it as set on the C# (netcoredbg)
card of Settings → Debugging, else in its own install, else in the free C#
extension for VS Code-compatible editors (muhammad-sammy.csharp), else on the
PATH. Microsoft’s own C# extension ships a debugger licensed only for
Microsoft’s tools, so Editora doesn’t use it. The card’s Install… downloads
netcoredbg 3.2.0-1092 and checks its SHA-256 checksum; Samsung builds none for
Intel Macs. The .NET SDK isn’t installed by Editora; it is found on the PATH
and in ~/.dotnet, where Microsoft’s install script puts it.
Debugging Ruby
Ruby is debugged with rdbg, the debugger of Ruby’s debug gem, which Ruby 3.1
and later ship. Debug: Start / Continue (debug.start, F5) or Debug
File runs the file under rdbg with ruby, with the arguments set by File:
Run with Arguments…, and stops at your breakpoints. The program’s output
reaches the Debug console. Ruby’s
exception breakpoints, Ruby: any raised exception
and Ruby: RuntimeError, are off by default, as in VS Code.
Editora finds rdbg as set on the Ruby (rdbg) card of Settings →
Debugging, else on the PATH, else in your own gem folders (such as
~/.local/share/gem/ruby/*/bin). The card’s Install… runs
gem install --user-install debug, which puts it in your gem folder, since a
system Ruby’s own gem folder belongs to root.
A launch.json rdbg configuration can also run a
script under bundle exec, or attach to a program started with rdbg --open.
Debugging PHP
PHP is debugged with Xdebug, through PHP Debug
(vscode-php-debug), the adapter VS Code uses. Debug: Start / Continue
(debug.start, F5) or Debug File starts php on the file with Xdebug
turned on for that run, with the arguments set by File: Run with
Arguments…, and stops at your breakpoints. The program’s output reaches the
Debug console. PHP’s exception breakpoints
(exceptions, errors, warnings, notices, deprecations, or everything) are off by
default.
PHP needs the Xdebug extension installed (on Debian and Ubuntu, the
php-xdebug package), and the adapter runs on Node.js 20.18 or later. Editora
finds PHP Debug as set on the PHP (Xdebug) card of Settings → Debugging
(its phpDebug.js, or the folder of the unpacked extension), else in its own
install, else in VS Code’s PHP Debug extension (xdebug.php-debug). The card’s
Install… downloads PHP Debug 1.40.2. Editora doesn’t install PHP or Xdebug.
PHP has no Attach to Process: Xdebug connects to a debugger that listens for
it. A launch.json php configuration without a
program, VS Code’s Listen for Xdebug, starts PHP Debug listening, and PHP
run elsewhere, such as by a web server, with Xdebug set to connect to it stops
at your breakpoints.
Debugging Bash
A Bash script is debugged with bashdb, through Bash Debug (vscode-bash-debug),
the adapter of VS Code’s Bash Debug extension. Debug: Start / Continue
(debug.start, F5) or Debug File runs the script under the bashdb that
Bash Debug ships, in the script’s folder, with the arguments set by File: Run
with Arguments…, and runs to your first breakpoint. Step Over, Step Into and
Step Out go line by line, and the script’s output reaches the Debug console.
A script is debugged when its shebang names bash or sh, or when it has no
shebang. A script of another shell, such as a .zsh or .fish file or a
#!/usr/bin/env zsh script, can’t be: Debug says so and points to
Run with Trace. A shell
run configuration can’t be debugged either; open its
script and debug that.
Variables lists only what bashdb gives, such as $PWD and $?. Read a
variable in a watch, the Debug console or by hovering it: total,
$total and ${total} all give its value. Bash has no exceptions, so there
are no exception breakpoints. A launch.json
bashdb configuration launches a script as VS Code does; Bash Debug can’t
attach to a script that is already running.
Bash Debug runs on Node.js and uses the bash, cat, mkfifo and pkill
on your PATH. Editora finds Bash Debug
as set on the Bash (bashdb) card of Settings → Debugging (its
bashDebug.js), else in its own install, else in VS Code’s Bash Debug
extension (rogalmic.bash-debug). The card’s Install… downloads Bash Debug
0.3.9 from Open VSX, with its own bashdb; Bash itself isn’t installed by
Editora.
launch.json configurations
Debug: Start Configuration… (debug.startConfiguration, in Run ▸ Launch
and Attach) lists the configurations of the project’s .vscode/launch.json, or
of the nearest one above the active file, and its compounds, and
starts the one you pick as VS Code would. A configuration started while a
session runs is debugged beside it, in a session of its own
(Several sessions). Type to filter the list; the configuration you started last is
listed first. With no launch.json, the status bar says so.
type | Debugger |
|---|---|
lldb | CodeLLDB, for Rust, C or C++. Its cargo field runs Cargo first and debugs the program Cargo built |
gdb | GDB’s own debug adapter mode (GDB 14 or later); attaches by pid |
cppdbg | GDB, or CodeLLDB when MIMode is lldb; attaches by processId |
go | Delve, with exec for a program you built yourself; mode: remote isn’t supported |
debugpy, python | debugpy; an attach connects to its connect address |
node, pwa-node | vscode-js-debug; an attach connects to its address and port |
java | the Java debugger: mainClass, projectName, args, vmArgs, cwd and env |
coreclr | netcoredbg, program being the built assembly; attaches by processId |
rdbg | rdbg, with useBundler for bundle exec; an attach connects to a local debugPort |
php | PHP Debug; without a program, it listens for Xdebug |
bashdb | Bash Debug, which launches a script under bashdb; it can’t attach |
chrome, msedge | vscode-js-debug driving a browser: a launch needs a url or a file; an attach connects to its port |
A debug adapter of your own is used by its
type too. Any other type, such as C# Dev Kit’s dotnet, is refused with a
message.
The file is read as VS Code reads it: comments and trailing commas are allowed,
and a configuration’s linux, osx and windows parts apply on that system.
- Variables:
${workspaceFolder},${file}and the rest of the${file…}family,${relativeFile},${lineNumber},${selectedText},${env:NAME},${userHome}and${pathSeparator}are filled in.${input:id}asks for its value once per start, as a list to pick from (pickString) or a prompt (promptString), before anything runs.${command:…}and${config:…}name VS Code’s own commands and settings, so they are refused with a message. preLaunchTask: a task of.vscode/tasks.jsonthat is ashellorprocesscommand runs first, in the Debug console, after Editora saves the folder’s edited files. The command is the folder’s own code, so in a folder you have not trusted it first asks you to trust the folder, naming the command; declining runs nothing. Restart runs the task again. Any other kind of task, or one withdependsOn, isn’t run: the status bar says to run it yourself first.
Compounds
A compound starts several configurations together, each in a session of its
own (Several sessions), in the order it lists them: a
server and its client, say. It comes from the project’s .vscode/launch.json,
or from the project’s own saved run configurations.
A launch.json compound is a compounds entry, read as VS Code reads it.
Debug: Start Configuration… lists it beside the configurations, as
compound · 2 configurations:
{
  "version": "0.2.0",
  "configurations": [
    { "name": "Server", "type": "debugpy", "request": "launch", "program": "${workspaceFolder}/server.py" },
    { "name": "Client", "type": "debugpy", "request": "launch", "program": "${workspaceFolder}/client.py" }
  ],
  "compounds": [
    { "name": "Server and client", "configurations": ["Server", "Client"], "stopAll": true }
  ]
}configurations: the configurations it starts, by name.preLaunchTask: a task that runs once, before any of them. Each configuration’s ownpreLaunchTaskstill runs before that configuration.stopAll: stopping one session of the compound stops them all.
An ${input:…} that several of its configurations use is asked once. When a
compound names a configuration that isn’t in the file, nothing starts, and the
status bar names the missing one.
A compound of run configurations debugs the project’s saved
run configurations together. Debug: Edit
Compounds… (debug.editCompounds, in Run ▸ Launch and Attach) opens the
Compounds window: the project’s compounds on the left and, for the one
selected, its Name, the Run configurations to debug together to tick,
and Stopping one stops them all. Add (debug.addCompound) makes a compound, Remove
deletes it, and Debug starts it. Every change is saved as you make it, with
the project. The ticked configurations start in the order the run
configurations are listed, each debugged as Debug a saved run
configuration debugs it, so each must be a kind that can be debugged (see
What a configuration can launch).
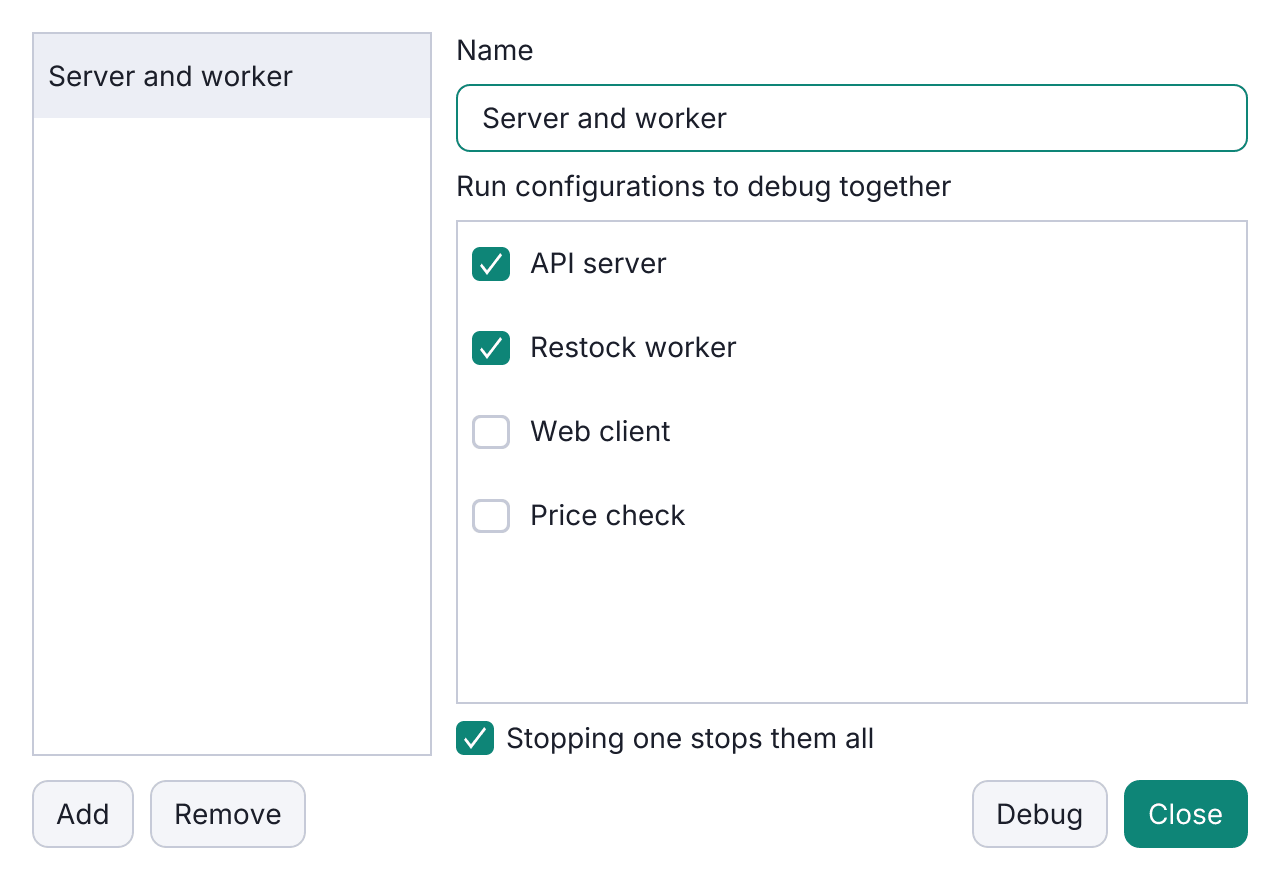
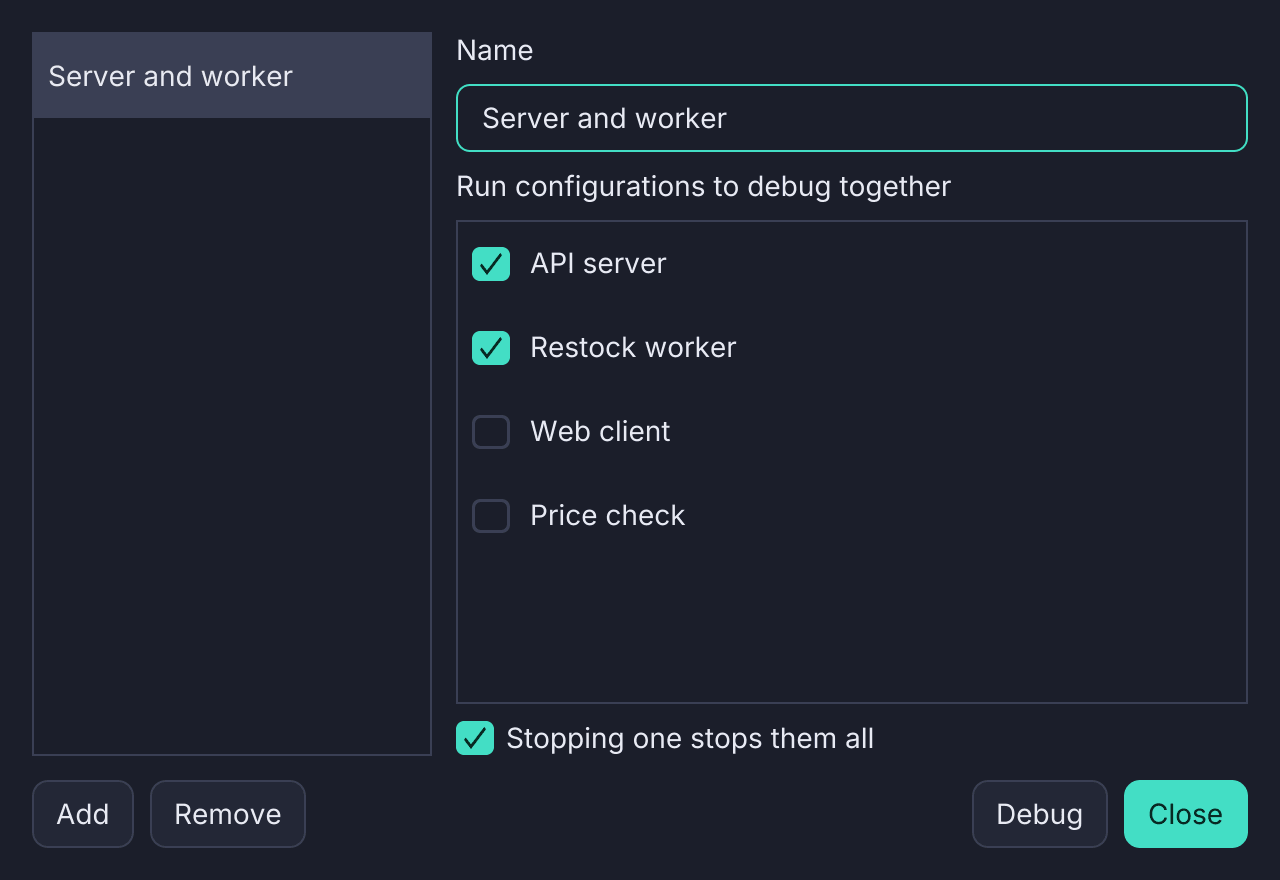
Debug: Start Compound… (debug.startCompound, in Run ▸ Launch and Attach) lists
both kinds, the project’s own first. Type to filter; New Compound…, last in
the list, opens the Compounds window on a new one.
The sessions of a compound build at the same time. When the compound stops them all, Stop in any of its sessions stops every one that still runs. Stop All stops every session, compound or not, and a program that ends by itself ends only its own session.
Debug adapters of your own
Any program that speaks the Debug Adapter Protocol can debug in Editora, such
as lldb-dap or a language’s own debugger. Debug: Edit Debug Adapters
(debug.editCustomAdapters, in Run ▸ Debugger) opens
debug-adapters.json in your config folder,
written with a commented example the first time. Each adapter says:
type: the name a launch.json configuration uses for it. It can’t be one of the types Editora handles itself, such aslldb,node,chromeorbashdb; for an adapter that names one, the status bar says so.command: the program and its arguments, as a list.transport: how Editora talks to it:stdio(the default),port(Editora picks a free port and puts it where the command says{port}), orannounce(the adapter prints the port it listens on;announceis a pattern whose first group is the port).languages: the file types F5 debugs with it, such as["zig"].nameandadapterID, optional.launch: what F5 sends it, with VS Code’s variables filled in. An adapter without one is started only from a launch.json configuration.
{
  "adapters": [
    {
      "type": "lldb-dap",
      "name": "LLDB (lldb-dap)",
      "command": ["lldb-dap"],
      "transport": "stdio",
      "languages": ["zig"],
      "launch": { "program": "${fileDirname}/${fileBasenameNoExtension}", "cwd": "${fileDirname}" }
    }
  ]
}
A trusted project can bring its own in
.editora/debug-adapters.json; they replace yours of the same type. An entry
that can’t be read is named in the status bar, and the others still work.
Debugging on a remote host
A file in a remote folder is debugged on its host, when that host may run commands, with breakpoints, stepping, variables and the call stack as for a local file. Breakpoints of a remote file are kept across reconnects. Remote is in Beta.
- Python runs debugpy on the host, which needs its own
(
pip install debugpy). The program itself runs as Run runs it there: under the project’s virtual environment on the host, else the host’s Python for Run and tests, with the project root andsrc/onPYTHONPATH. debugpy runs under the host’s Python for debugging. The program’s output reaches the Debug console, but it can’t read typed input there. - JavaScript runs vscode-js-debug and
nodeon the host, from the script’s package folder there, as Run does. The program’s output reaches the Debug console, but it can’t read typed input there. - Java in a Maven or Gradle project goes through the host’s
jdtls: Debug, Debug Main Class, Attach (wherelocalhostis the host), Debug Test, and a saved configuration. Editora copies its java-debug plugin to~/.cache/editoraon the host. A Java file outside a project is compiled on the host for the debugger.
The adapters’ locations can be set per host in Settings → Remote (Python for debugging, JavaScript debugger (vscode-js-debug), Node.js, java-debug plugin jar). Other languages cannot be debugged on a host yet.
A Java configuration that runs on a deployment is debugged on its host too: the program starts there and the debugger attaches through a tunnel, with breakpoints in the local files.
Debugging in a container or WSL
A project whose tools run in a container
or in a WSL distribution is debugged there,
as on a remote host: Python with the debugpy installed there (the program under
the project’s virtual environment there, as Run uses it), JavaScript with
vscode-js-debug and node there, and Java through the jdtls running there, with
Editora’s java-debug plugin copied into ~/.cache/editora. A Java file outside
a project is compiled there for the debugger. The debugger’s port inside is
reached from here whatever the container’s network, through a relay that needs
nc, bash or python3 inside (see
Ports and debuggers). Containers and WSL
are part of Remote, which is in Beta.
Installing adapters
Adapters are not bundled. Each language’s card on Settings → Debugging has an Install… button that downloads what is missing into your config folder: for Java and Python, the adapter together with its language server. The same installs are three palette commands:
| Command | Installs | Needs |
|---|---|---|
Install: Java Language Support (install.javaSupport) | jdtls and the Microsoft java-debug plugin | tar, and a JDK to run jdtls |
Install: Python Language Support (Pyright, debugpy) (install.pythonSupport) | Pyright and debugpy | Python with pip for debugpy; Node.js with npm for Pyright |
Install: TypeScript / JavaScript (Node.js) Language Support (install.jsSupport) | typescript-language-server 5.3.0 with TypeScript 5.9.3, and vscode-js-debug v1.117.0 | Node.js with npm, and tar |
The Java and Python cards on the Settings → Debugging page have the same
Install… button; the JavaScript card’s Install… installs only
vscode-js-debug. The Go (Delve) card’s Install… runs go install for
Delve, the Rust, C and C++ (CodeLLDB) card’s downloads CodeLLDB, the C#
(netcoredbg) card’s downloads netcoredbg, the Ruby (rdbg) card’s runs
gem install for the debug gem, and the PHP (Xdebug) card’s downloads PHP
Debug; see Debugging Go, Debugging Rust,
Debugging C#, Debugging Ruby and
Debugging PHP. An install fetches only what is missing. When one tool’s
runtime is missing, the others still install and the status bar names the one
that waits (debugpy installs without Node.js, for example). When Python has no
pip, the error says so. After a debugger installs while debugging is off, the
status bar says where to turn it on.
Editora does not install those runtimes for you. A downloaded server or adapter is unpacked beside the installed version and replaces it only once it is complete, so a failed install leaves the working one in place.
To install an adapter by hand instead, the Editora repository has a helper script for each:
- Java: the Microsoft java-debug plugin (layered onto
jdtls),scripts/install-java-debug.sh. If yourjdtlsdistribution already bundles and loads java-debug itself (Homebrew’s does), Editora detects that and needs no second copy. - Python:
debugpy,scripts/install-debugpy.sh. - JavaScript: vscode-js-debug,
scripts/install-js-debug.sh.
Each card on Settings → Debugging has a Detected line, for example debugpy: found (/usr/bin/python3) (the interpreter that has debugpy) or js-debug: not found, also while that language’s debugging is switched off. The Java, JavaScript, Go, Rust, C#, Ruby and PHP cards also have the adapter’s path field with Browse… (C and C++ use Rust’s CodeLLDB path, or the GDB path), and every card but Java’s a switch that turns that language’s debugging on or off. While Enable debugging (DAP) is off, the cards are greyed and a note says to turn it on. Python has no path field there: debugpy runs under a Python interpreter, and the Python interpreter (fallback for Run, Debug and code intelligence) is on the Python card of Settings → LSP, which stays editable with debugging off. It is the Python used when a project has no interpreter of its own, and the one that runs debugpy when the project’s interpreter cannot import it. A link at the top of the Debugging page leads there.
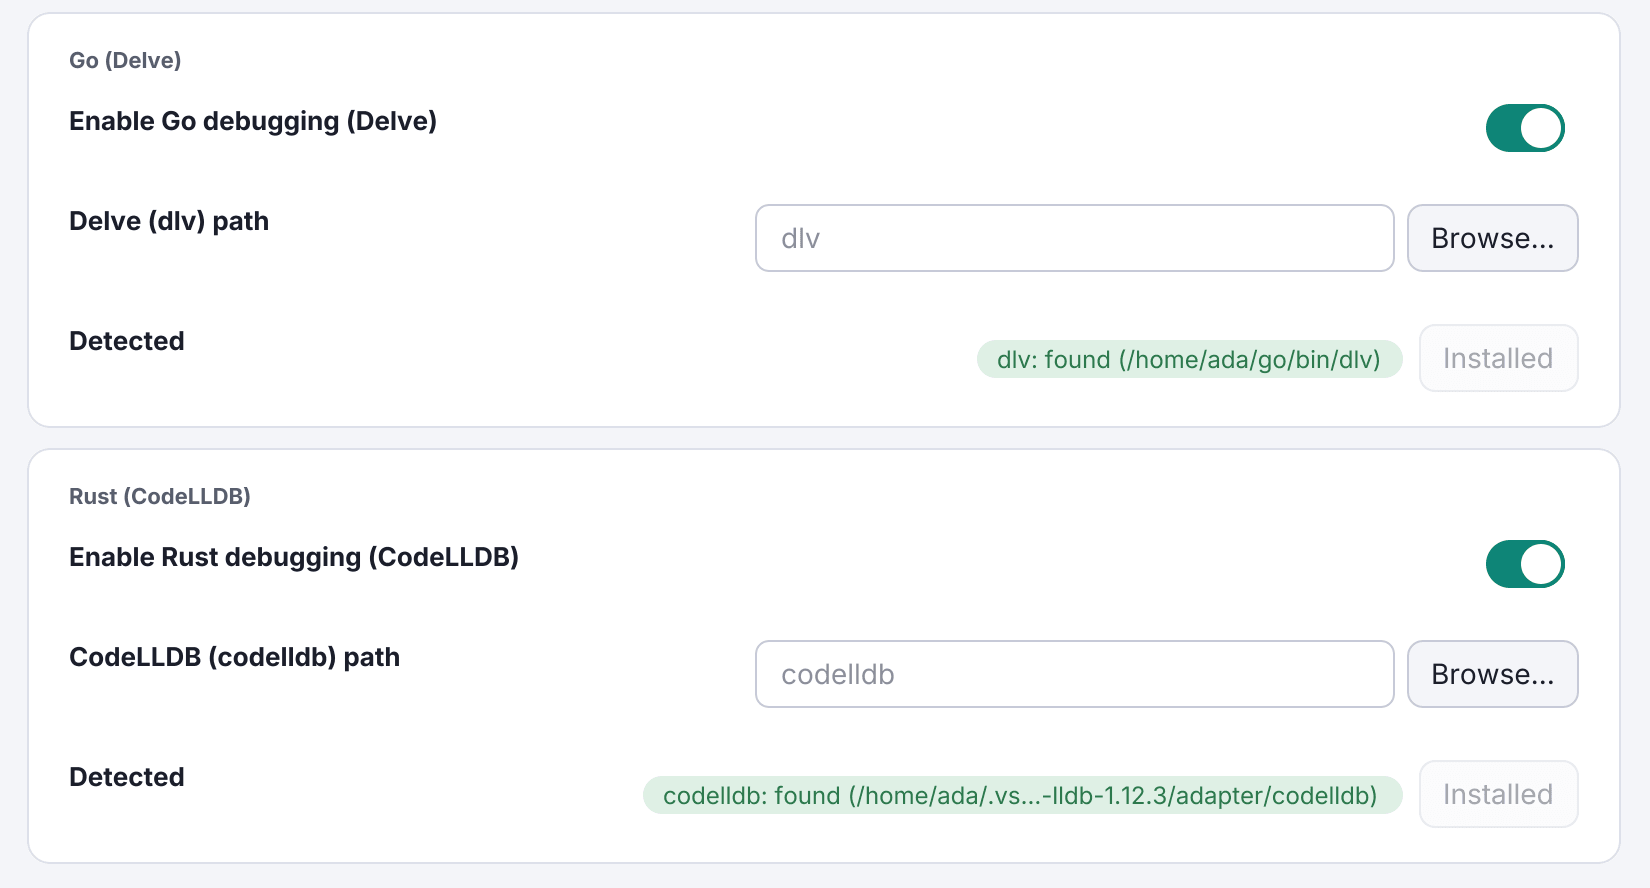
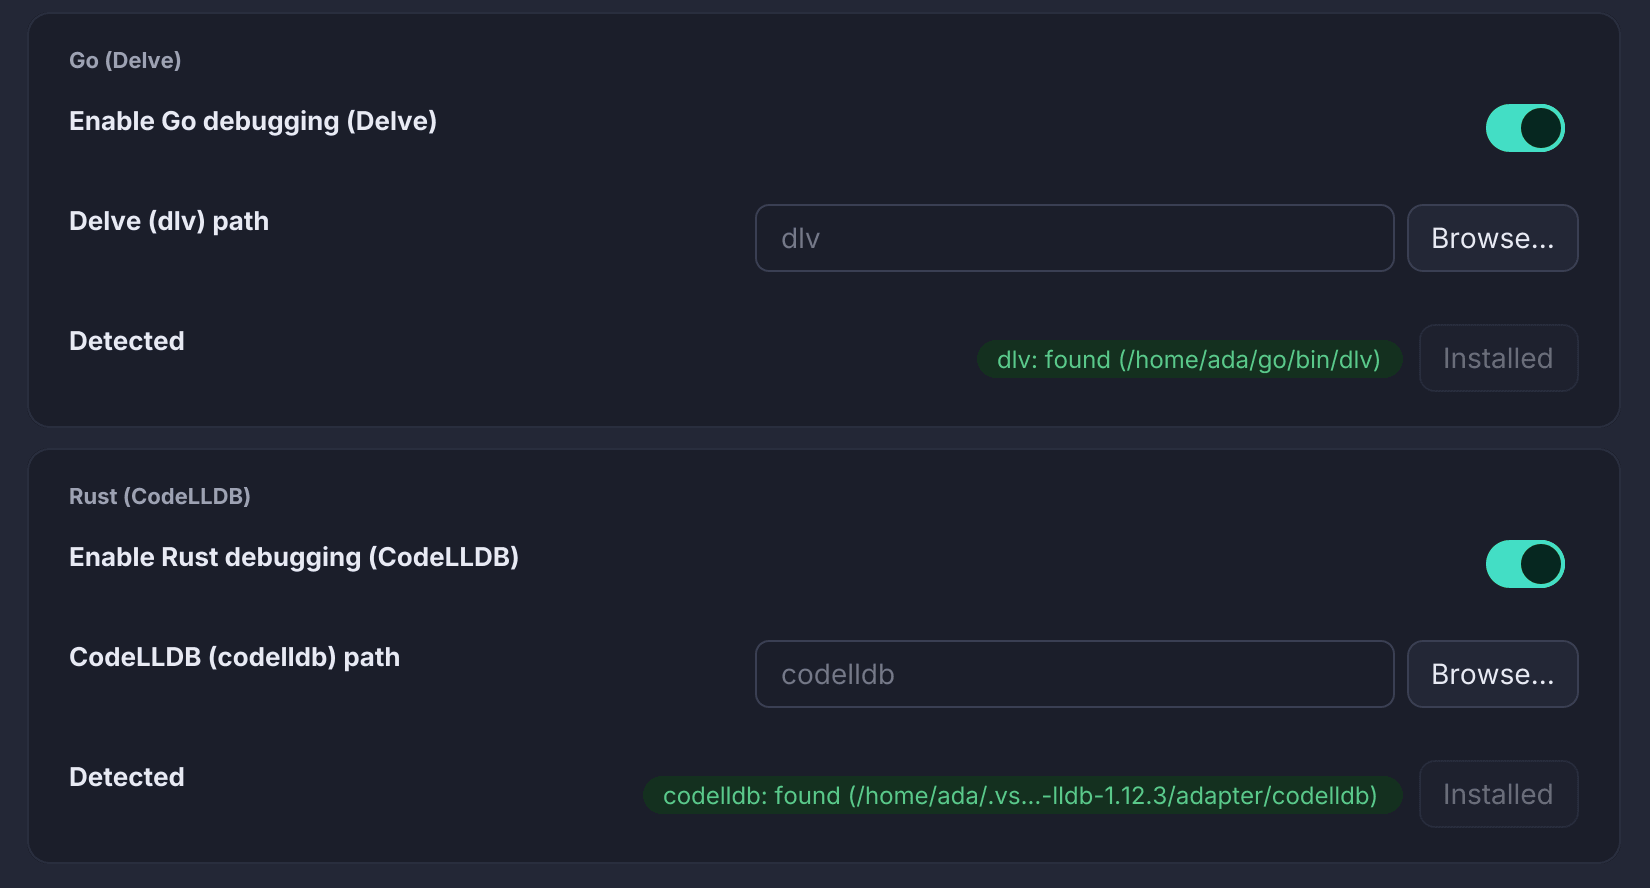
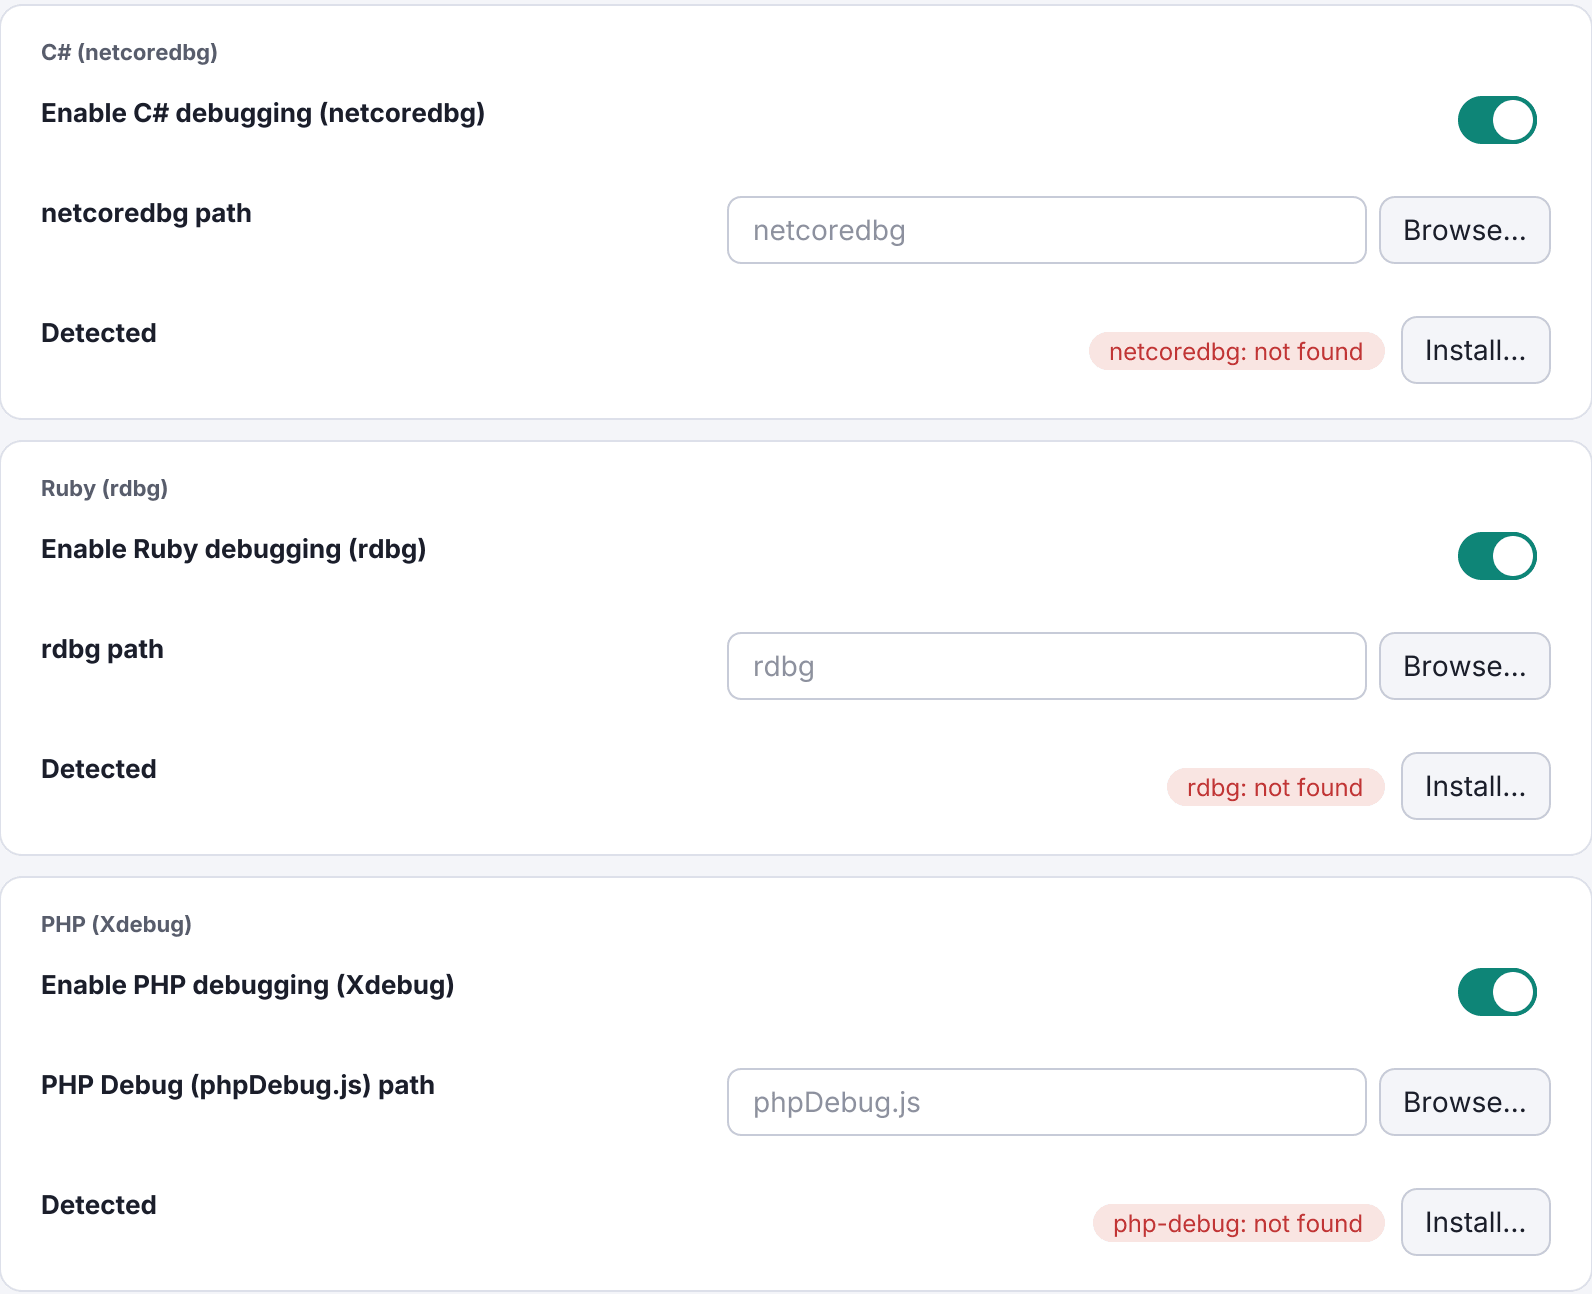
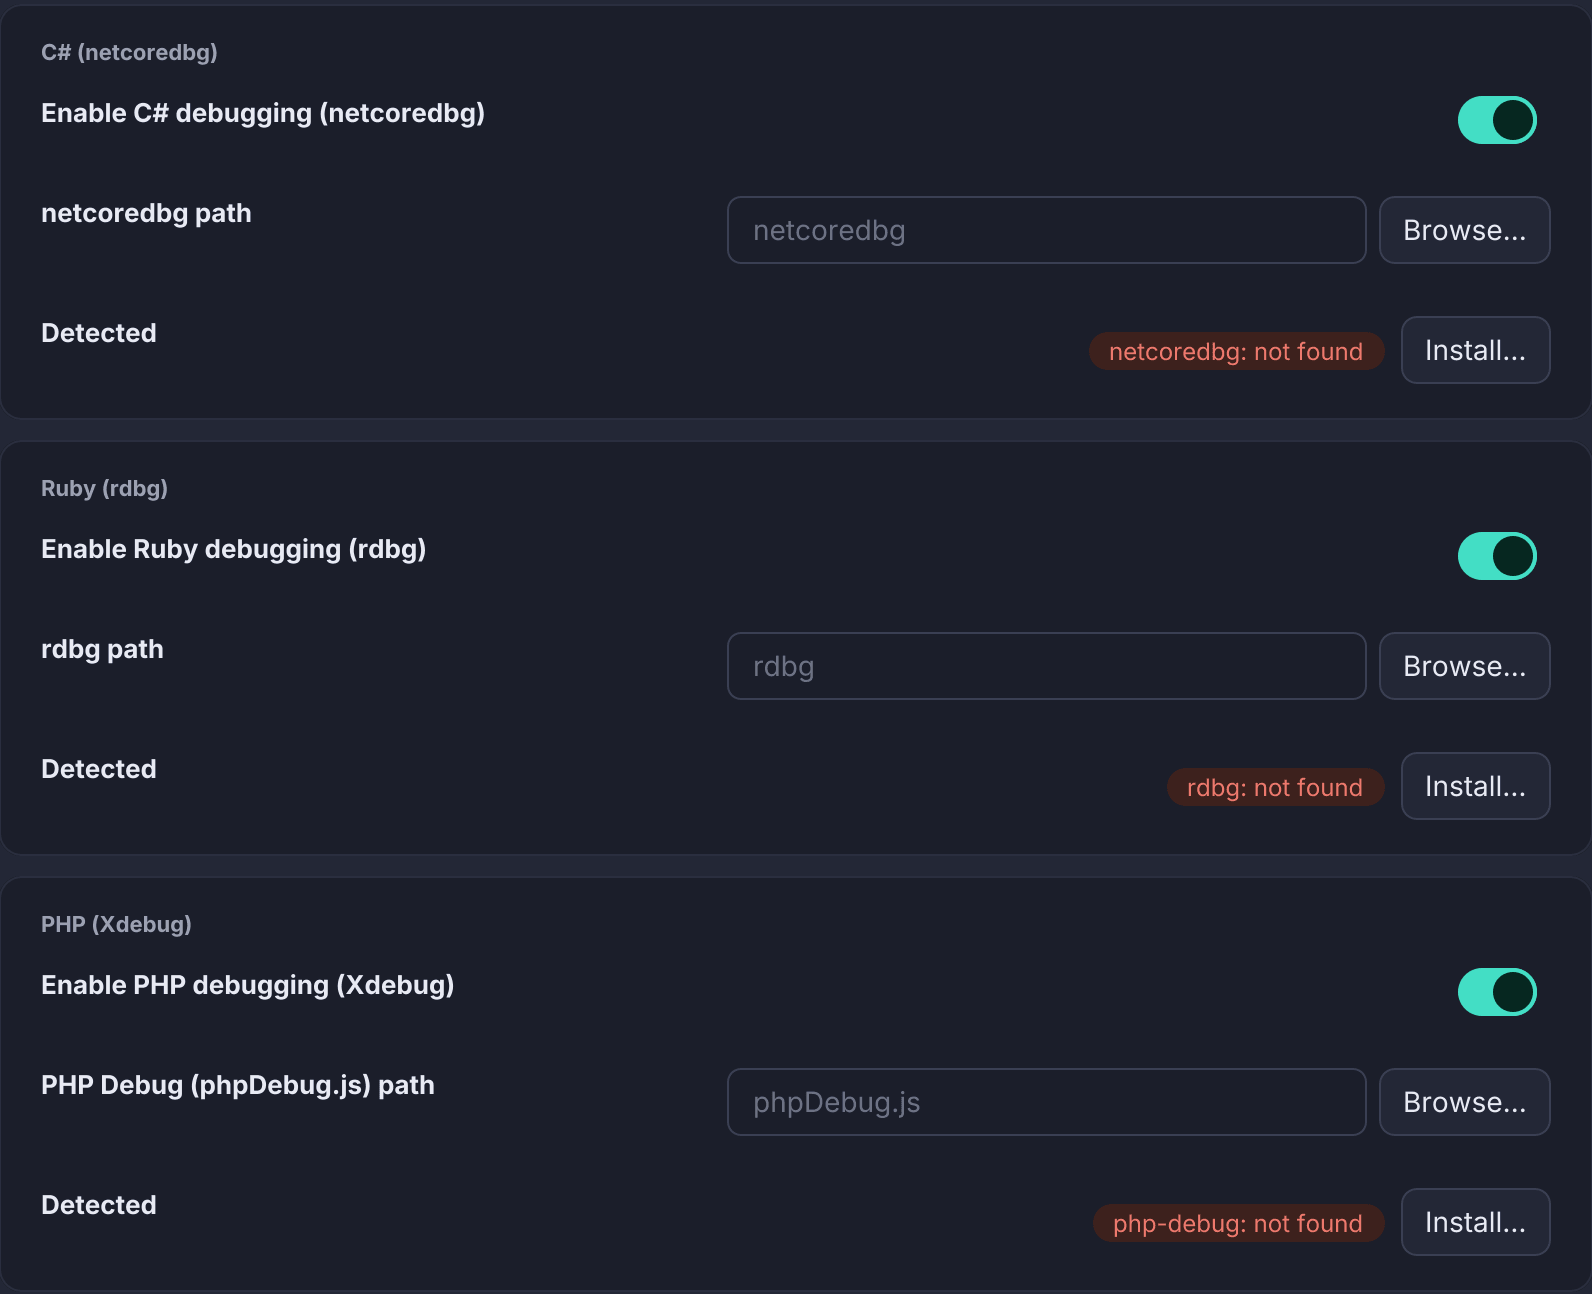
For sending HTTP requests from .http files, see the
HTTP client. For Maven, Gradle, npm, Cargo, Go, sbt,
Mill, Scala CLI, Clojure CLI, Leiningen and Babashka tasks, see
Build tools. The first build in a folder, wrapper or
not, asks you to trust the folder first,
because the build runs code the repository supplies; only Go builds are not
asked about, since go build never runs a module’s code.